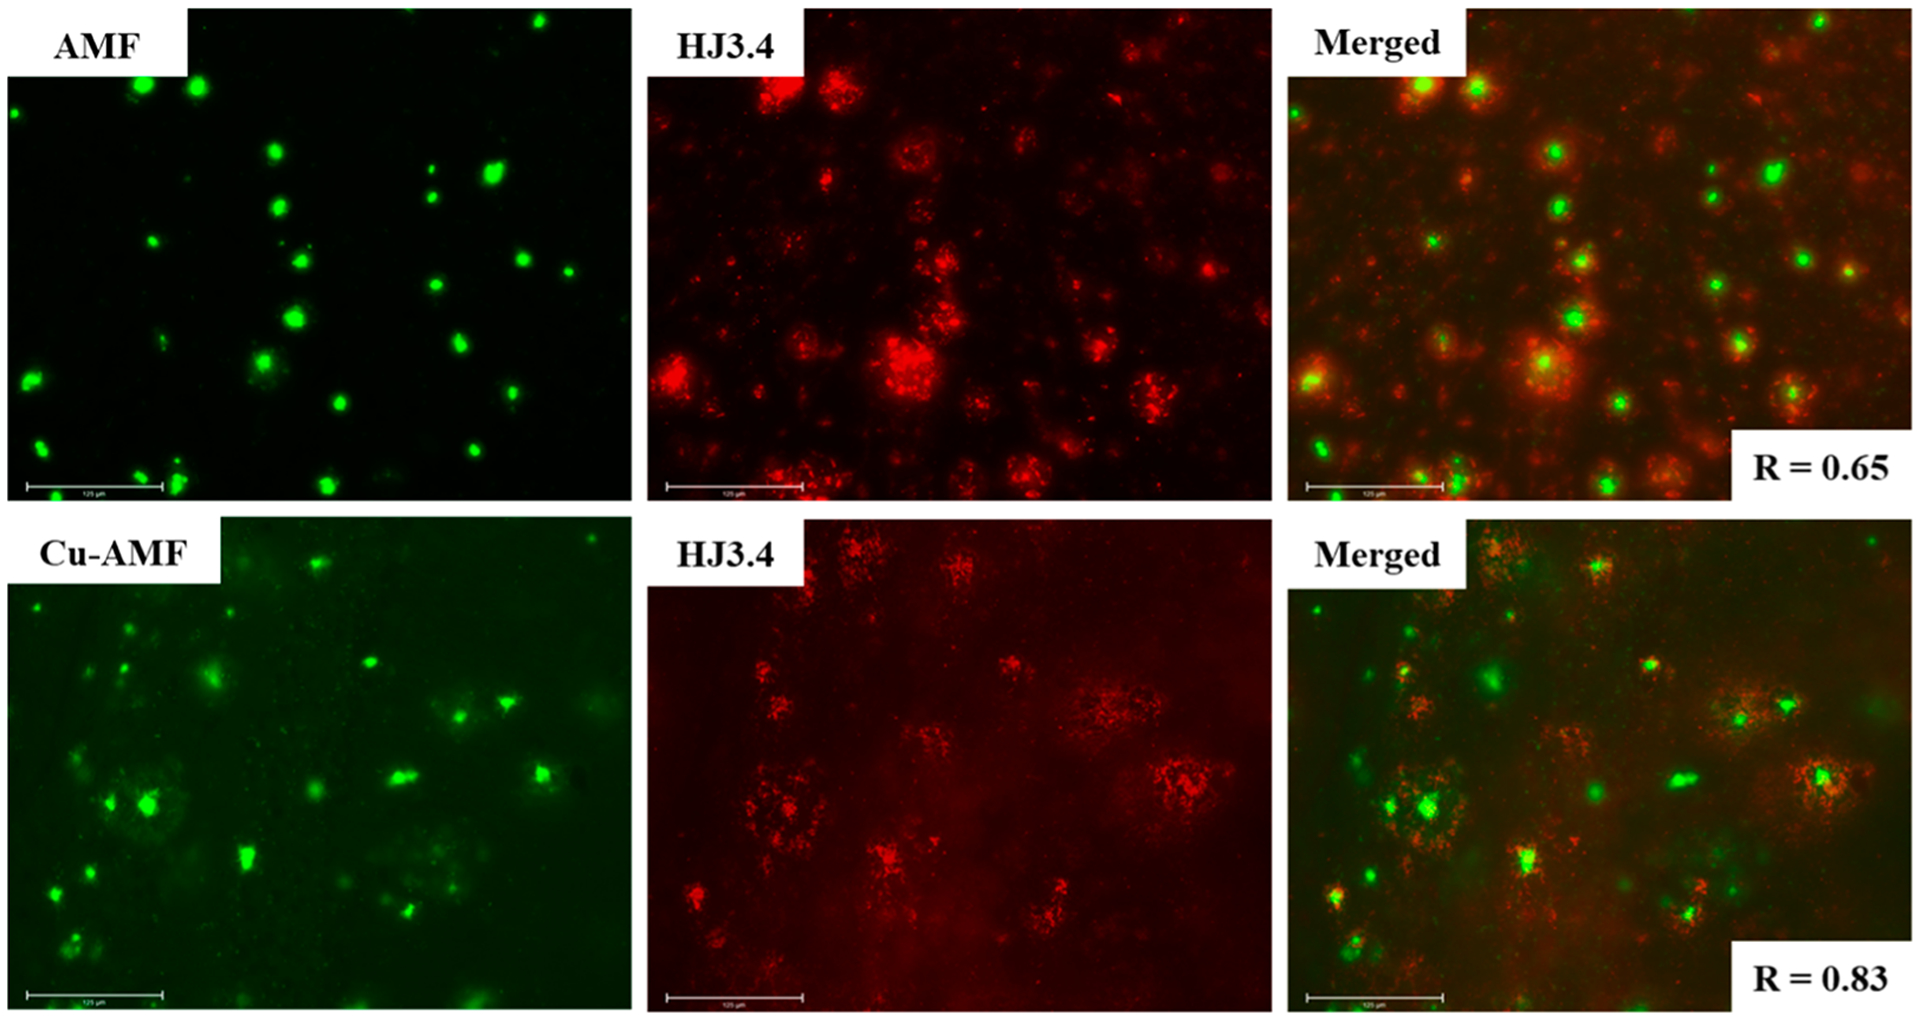
Figure 7.

Fluorescence microscopy images of 5xFAD mice brain sections coincubated with AMF and Cu-AMF (left panels), HJ3.4 antibody (middle panels), and merged images (right panels, along with the Parson’s correlation coefficients R). Concentrations used: [AMF] = [Cu2+] = 25 μM, [HJ3.4] = 1 μg/mL (scale bar: 125 μm).
