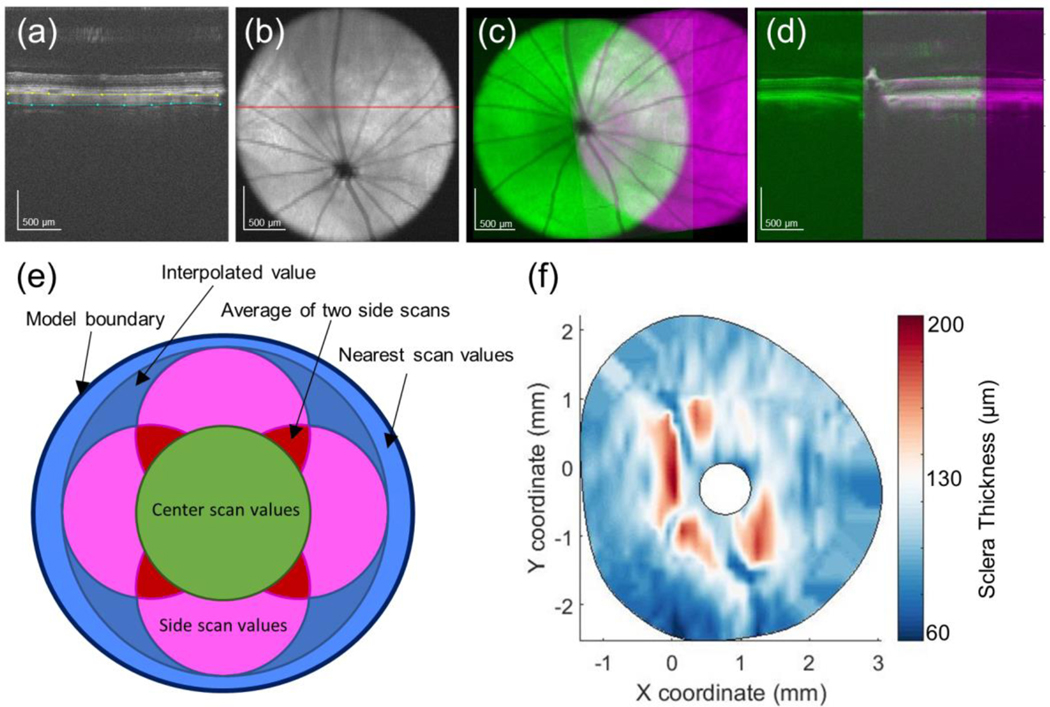
Fig. 1.
Measuring scleral thickness from SD-OCT scans. a SD-OCT B-scan with the anterior (yellow) and posterior (cyan) scleral surfaces delineated. b Average intensity projection through the sclera, choroid, and retina. Red line indicates b-scan in panel a. c Registration of two SD-OCT volume scans, obtained by aligning the ONH and retinal vessels as seen in two average intensity projection images. d Registration of the same two SD-OCT volume scans in the axial direction by aligning the anterior scleral surface as seen in two b-scans passing through the ONH. The colors in this panel are identical to those in panel C. e Schematic detailing how thickness data from five SD-OCT volumes was combined into a single thickness map. f Typical final thickness map for a rat sclera

