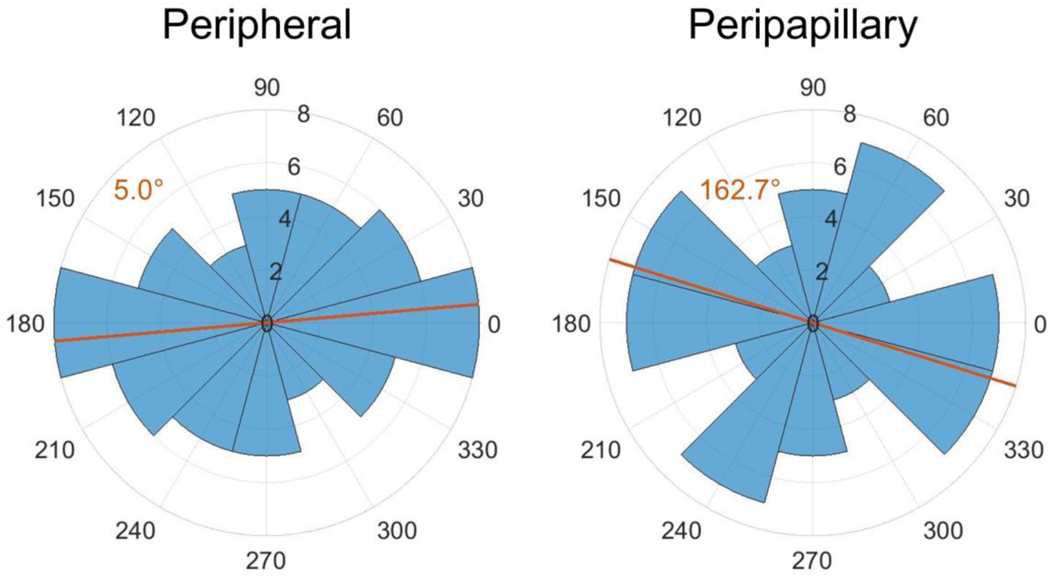
Fig. 10.
Symmetric rose plots (circular histograms) of the fiber orientations in the peripheral and peripapillary scleral regions. Each blue wedge represents a bin of width 30°. The radius of each wedge indicates the number of θp values in that bin. Note that since the plot is symmetric, the number of θp values plotted is 64 rather than 32. The orange lines indicate the mean preferred fiber direction which is also given in the orange text. Both mean directions suggest an overall circumferential alignment in the peripheral and peripapillary sclera

