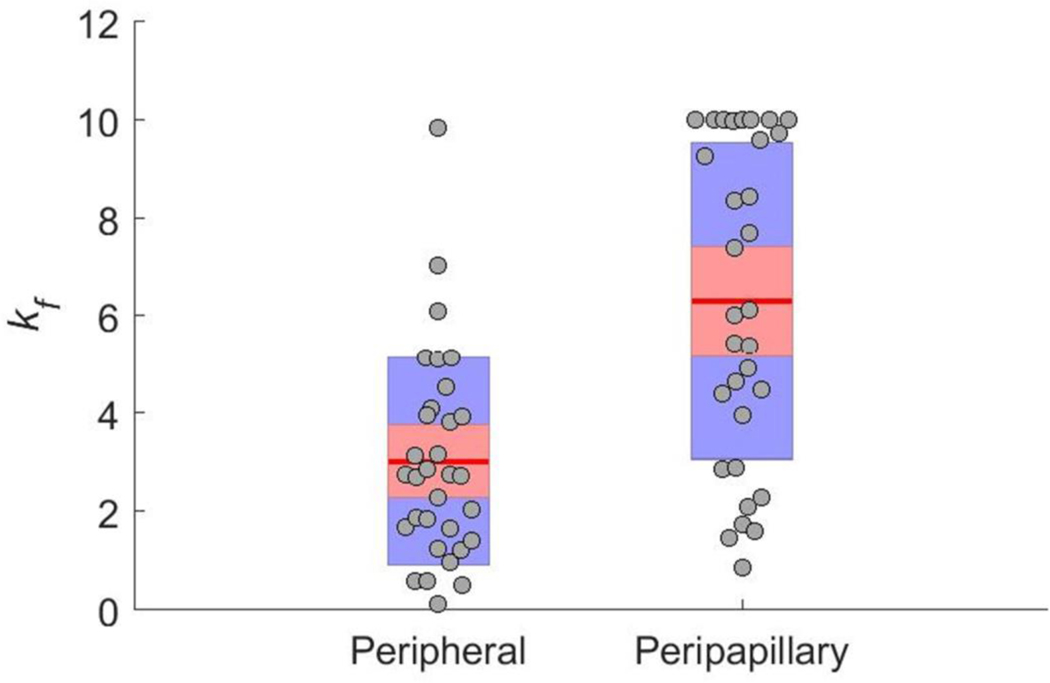
Fig. 8.
Peripheral and peripapillary scleral fiber concentration factor (kf) values as determined by inverse FEM. Circles indicate raw values, the red line indicates the mean, the red box indicates the 95% confidence interval, and the blue box indicates the standard deviation. The fiber concentration factor was higher (on average) in the peripapillary region (Wilcoxon; p < 0.0001)

