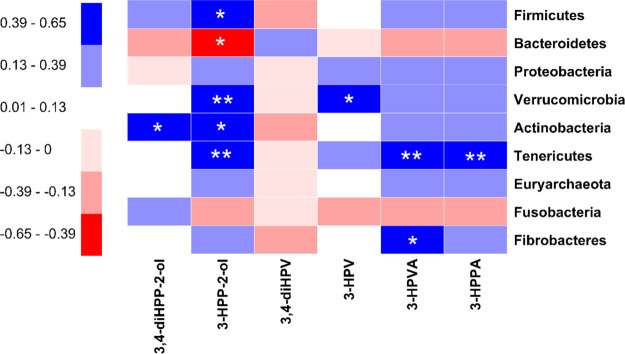
Figure 8.
Spearman correlations between the taxon abundances of nine bacterial phyla and the concentration of six major EC microbial metabolites present in incubations with fecal slurries from 24 individuals at 2 h. The sign and strength of the Spearman correlation coefficients are represented as colors (blue: positive; red: negative). The significances of the correlations are indicated by asterisks: *P < 0.05, **P < 0.01.

