Figure 5.
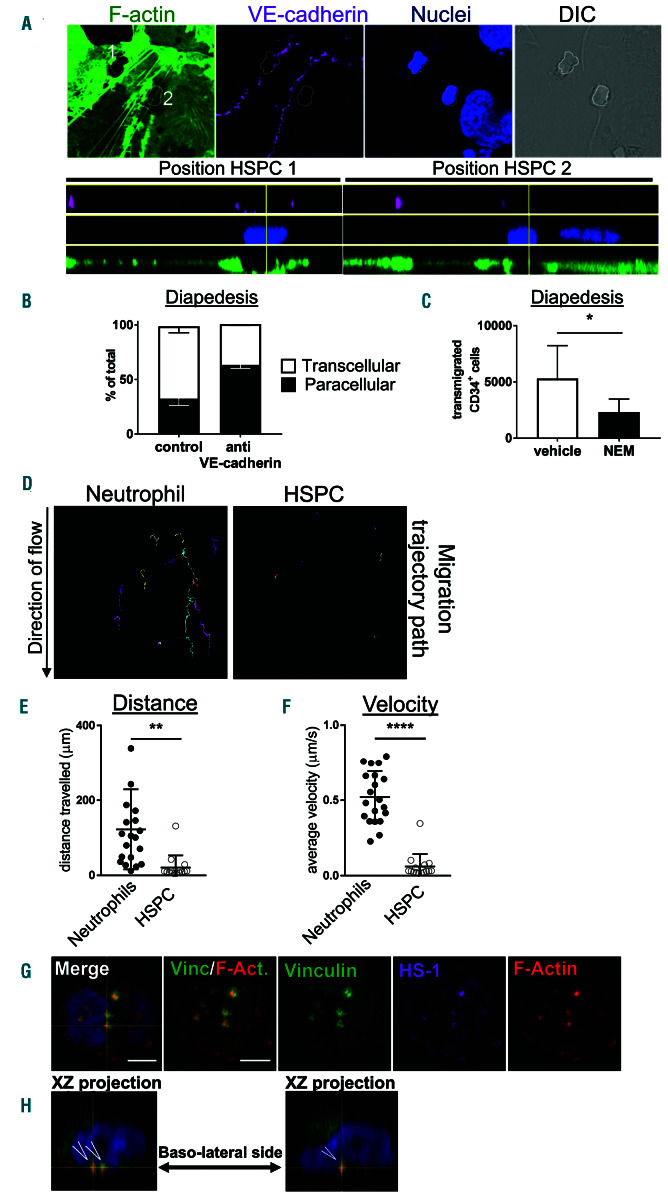
Hematopoietic stem and progenitor cells predominantly use the transcellular route of migration across bone marrow endothelium by forming podosome-like structures. (A) IL1b-pretreated immortalized human BM endothelial cells (HBMEC) were cultured and transfected with GFP-LifeAct (green) to monitor F-actin dynamics during hematopoietic stem and progenitor cells (HSPC) interactions. Both migration routes were detected for HSPC migration across HBMEC: paracellular with junctions marked by VE-cadherin (magenta), and transcellular, nuclei stained in blue and DIC shows overview. White dotted lines indicate localization of human HSPCs with #1 representing paracellular migration and #2 representing transcellular migration. Lower panel shows XZ projection with position HSPC 1 for paracellular migration (illustrated by the two magenta stains at the side) and position HSPC 2 for transcellular migration. Scale bar: 20 mm. (B) Quantification of transmigration route of HSPC. Open bar represents percentage of cells that cross transcellularly, and closed bars represent percentage that crosses paracellularly (mean ± standard error of the mean [SD], n=3 per group). Anti-VE-cadherin indicates that VE-cadherin function is blocked and promotes paracellular pathway. (C) Blocking of membrane fusion events in HBMEC by N-Ethylmaleimide (NEM) impairs HSPC transendothelial migration towards CXCL12 in an in vitro Transwell system (Mean ± SD, n=3 per group). (D) Migration tracks of cells under flow conditions show highly motile neutrophils and passive HSPC, quantified by distance traveled on the apical surface of HBMEC in μm (E) or average velocity (μm/s) (F). These experiments were independently carried out at least three times. (G) HSPC were treated for 30 minutes with PMA showing the induction of podosomes, based on typical podosome markers: vinculin (green) in the circle and HS-1 (magenta) and F-actin (red) in the core. Scale bar: 3 mm. (H) Orthogonal projection shows the distribution of the podosomes at the basolateral surface (open arrowheads) with F-actin in red, vinculin in green and the nucleus in blue.

