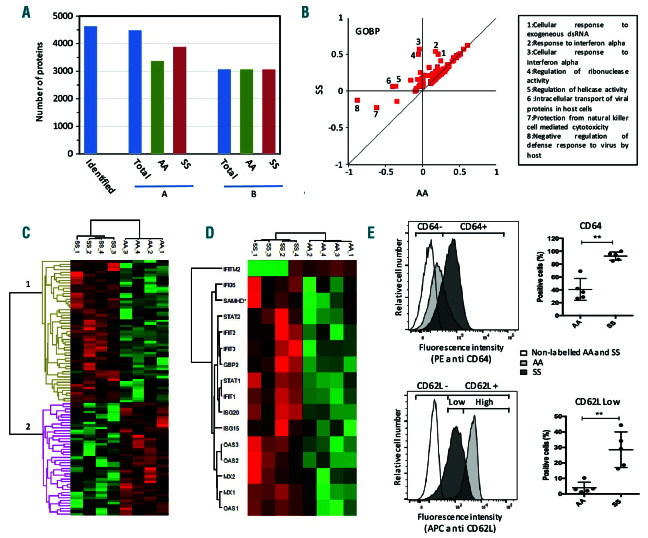
Figure 1.
Proteomic analysis of neutrophils from healthy donors (AA) and SS genotype patients (SS) at steady state. (A) Overall proteomics results: number of proteins identified and quantified in at least one sample (A) or in at least three samples and in at least one group (B). (B) 2D enrichment analysis of the proteins expressed in at least 75% of the samples and in at least one group. Protein annotation databases from GOBP. Annotations out of the diagonal corresponding to differential expression in SS or AA samples are indicated. (C) Cluster analysis of proteins differentially expressed in SS and AA neutrophils. Proteins with significantly different expression values (P<0.05 and fold change>0.3) were selected, their LFQ values were z score transformed and analyzed by Euclidian clustering. Clusters 1 and 2 correspond to proteins upregulated and downregulated in SS neutrophils, respectively. (D) Cluster analysis of differentially expressed proteins with the “cellular response to type I interferon” GOBP annotation. (E) Characterization of neutrophils from SS patients by flow cytometry analysis, typical result: over-expression of the Fc fragment of IgG/CD64 and under-expression of L-selectin/CD62L. Data are presented as mean ± standard devaition (SD). Mann-Whitney test was used to compare SS and AA; *P<0.05 compared with AA; **P<0.01 compared with AA.

