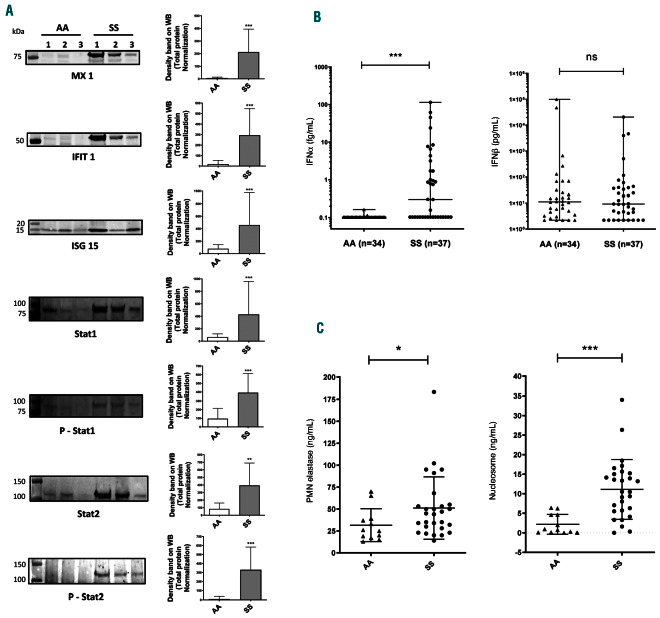
Figure 2.
Activation of IFN-1 pathway in SS gentype neutrophils. (A) Representative images of Western blots for MX1, IFIT-1, ISG15, STAT 1, Phospho-STAT 1, STAT 2 and Phospho-STAT 2 expressed in neutrophils from healthy volunteers (AA, n=10) and SS patients (SS, n=10). The Western blots are represented as the ratio of the density of the specific band on the total protein in each sample. (B) Level of IFNα and IFNb in plasma from healthy donors (AA, n=34) and SS patients at basal state (SS, n=37) using a digital-ELISA assay (SIMOA). (C) Level of neutrophil elastase and nucleosome in plasma from healthy donors (AA, n=12) and SS patients at basal state (SS, n=28) using ELISA assay. Data are presented as mean ± standard devaitaion (SD). Mann-Whitney test was used to compare SS and AA; *P<0.05 compared with AA; **P<0.01 compared with AA; ***P<0.001.

