Figure 4.
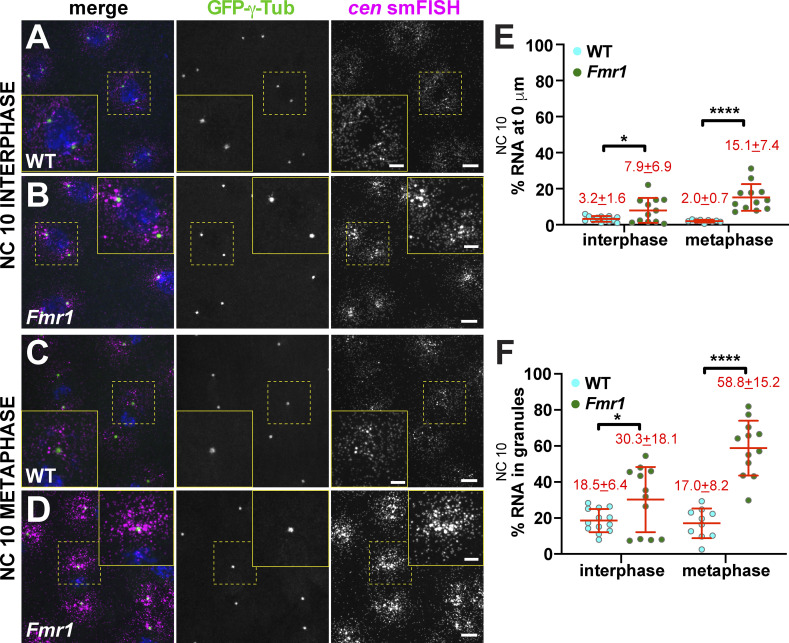
Fmr1 regulates cen mRNA granule formation. Maximum-intensity projections of cen smFISH (magenta) in NC 10 embryos expressing GFP-γ-Tub (green). Boxed regions are enlarged at right (yellow box, zoom). (A) WT NC 10 interphase embryo with cen mRNA at centrosomes. (B) Fmr1 embryo with more granular, pericentrosomal cen mRNA. (C) WT NC 10 metaphase embryo. (D) Fmr1 embryo showing increased cen mRNA at centrosomes. (E) Percentage of cen mRNA overlapping with centrosomes in WT versus Fmr1 embryos. (F) Percentage of cen mRNA within granules. Each dot is a single measurement from n = 13 interphase and 10 metaphase WT and n = 12 interphase and metaphase Fmr1 embryos. Mean ± SD displayed (red). Table 1 lists number of objects quantified per condition. *, P < 0.05; ****, P < 0.0001 by unpaired t test. Scale bars: 10 µm; 2.5 µm (insets).

