Figure S1.
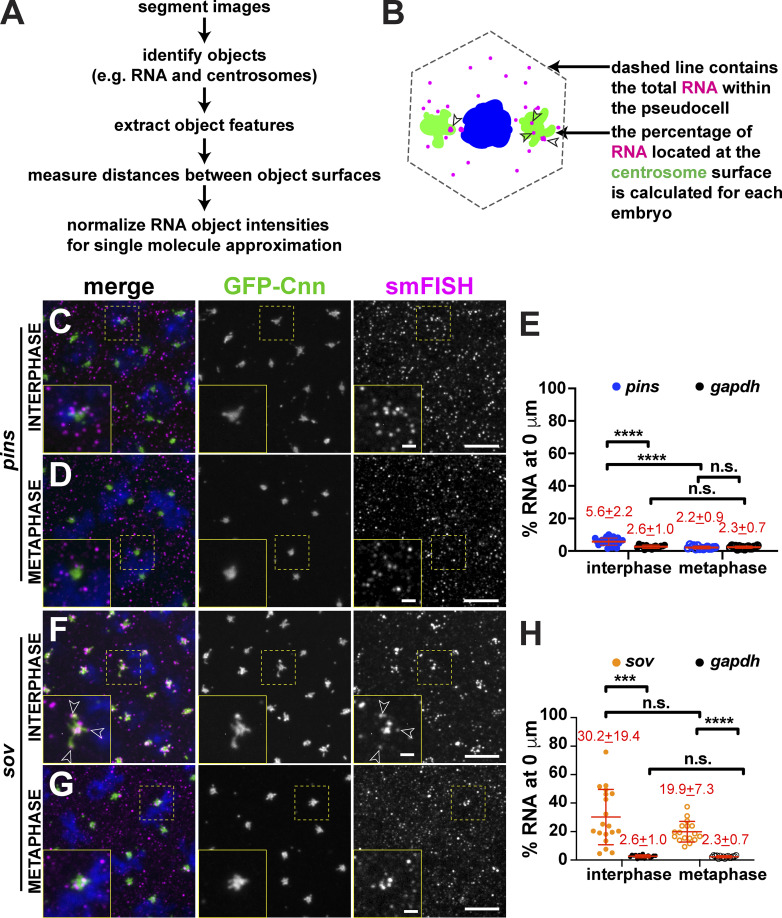
Determining mRNA enrichment at centrosomes. (A) Workflow used to quantify RNA distributions relative to centrosomes. (B) Cartoon shows total RNA (magenta) within a syncytial Drosophila embryo pseudocell (dashed line). Arrowheads show RNA overlapping with the centrosome (green) surface. (C–H) Maximum-intensity projections and quantification of smFISH for pins or sov mRNAs (magenta) in interphase and metaphase NC 13 embryos expressing GFP-Cnn (green). Boxed regions are enlarged in the insets. Open arrowheads denote association of sov mRNA with centrosome flares. Quantification of the percentage of RNA overlapping with the centrosome surface (0 µm distance) is shown to the right, where each dot represents a single measurement from n = 16 interphase and metaphase (gapdh mRNA), n = 24 interphase and 15 metaphase (pins mRNA), and n = 19 interphase and 17 metaphase (sov mRNA) embryos. Mean ± SD are shown (red text). (C–H) pins (C–E) and sov (F–H). Note that values for gapdh are reproduced from Fig. 1 C to facilitate comparison. Table 1 lists the number of embryos, centrosomes, and RNA objects quantified per condition. ***, P < 0.001; and ****, P < 0.0001 by ANOVA followed by Dunnett’s T3 multiple comparisons test. Scale bars: 5 µm; 1 µm (insets). n.s., not significant.

