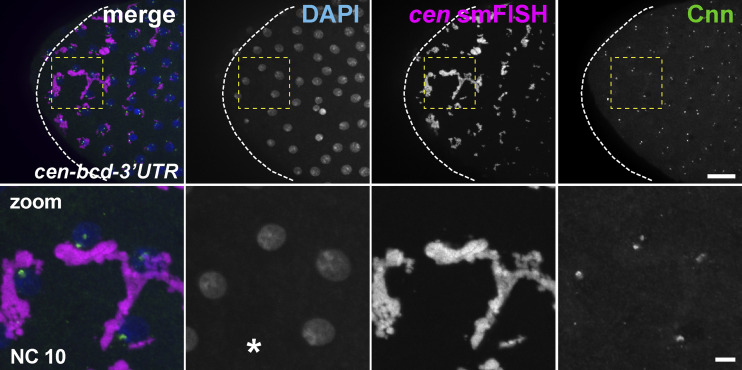
Figure S3.
Deregulation of cen mRNA granule formation. (A) Immunoblots show Cen protein content relative to the actin loading control from 1–3-h embryonic extracts and are quantified in A′. Levels of Cen were normalized to the mean WT levels of actin from n = 3 independent biological replicates, each with n = 2 technical replicates run on the same gel. (B) Maximum-intensity projection of an interphase NC 10 embryo for cen mRNA labeled by smFISH (magenta), DAPI (nuclei, blue), and Cnn showing large cen RNPs. Asterisk marks nuclear fallout. Boxed regions enlarged below (zoom). Scale bars: 10 µm; 2 µm (insets).

