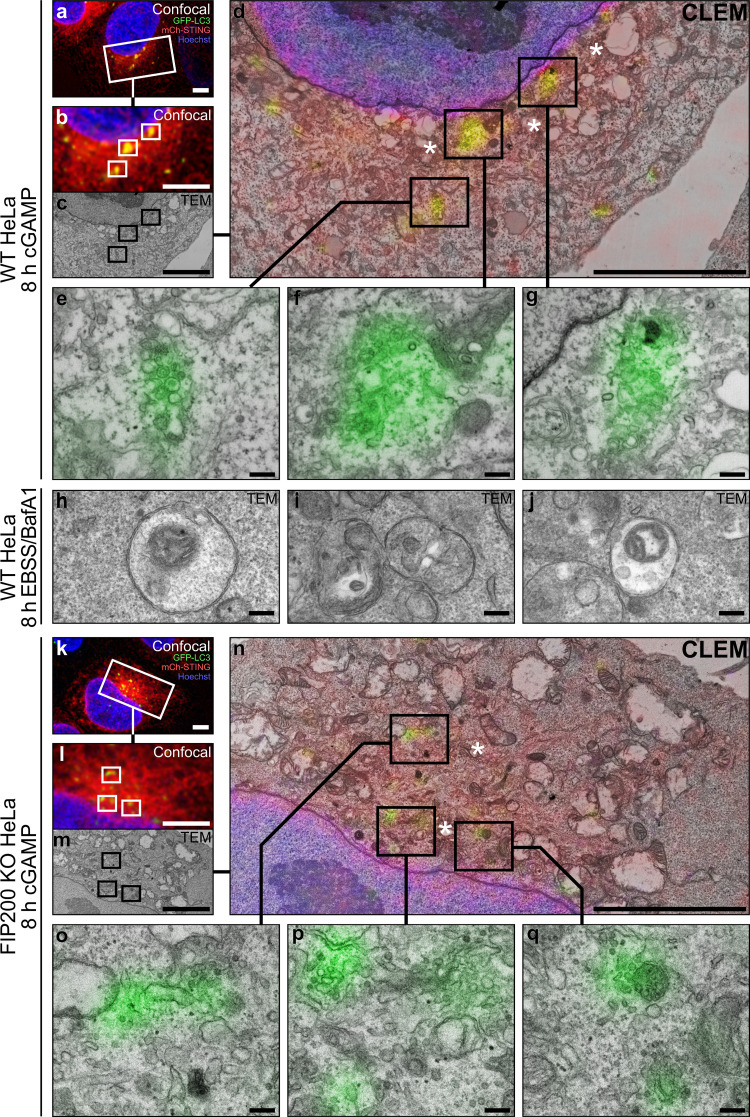
Figure 4.
GFP-LC3B is targeted to perinuclear single-membrane vesicles upon STING activation by cGAMP. (a) Confocal image data (deconvolved; maximum projected) acquired from WT HeLa cells expressing GFP-LC3B (green) and mCh-STING (red), and stained with Hoechst 33342 (blue) after 8 h cGAMP (60 µg/ml) incubation, before correlative imaging of the indicated region of interest (white inset frame). (b–d) Spatial alignment between the (b) optical and (c) electron micrographs acquired within the region indicated in a, (d) with direct overlay between imaging modalities. (e–g) Correlative micrographs of GFP-LC3B–positive structures detected from d. (h–j) Representative electron micrographs of starvation induced autophagosomal structures in WT HeLa cells after 8 h incubation with Earle's Balanced Salt Solution in the presence of BafA1 (100 nM). (k) Confocal image data (deconvolved; maximum projected) acquired from FIP200 KO HeLa cells expressing GFP-LC3B and mCh-STING, stained with Hoechst 33342 after 8 h cGAMP (60 µg/ml) incubation. (l–n) Spatial alignment between (l) optical and (m) electron micrographs acquired at region indicated in k, (n) displayed with direct overlay between micrographs. (o–q) Selected examples of GFP-LC3B–positive structures detected from n. Portions of the Golgi apparatus indicated by asterisk. Scale bars, a–d and k–n, 5 µm; e–j and o–q, 200 nm. EBSS, Earle's Balanced Salt Solution.

