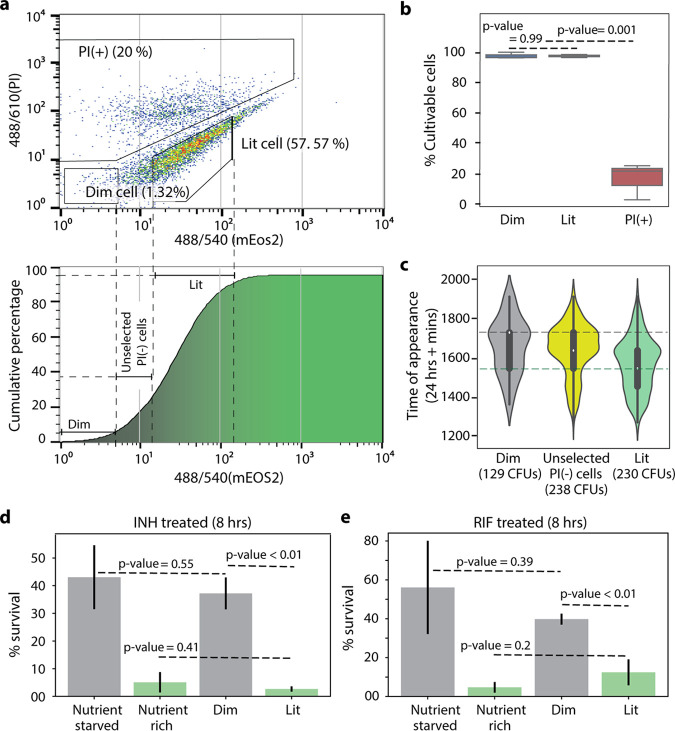
FIG 2.
PerSort isolation and characterization of subpopulations from anhydrotetracycline (ATc)-induced MSM-mEos2 cultures. (a, top) Population structure of ATc-induced (500 ng/ml) MSM-mEos2 cells from single-cell gates, represented by mEos2 fluorescence on the x axis and propidium iodide (PI) (5 μl/ml) fluorescence on the y axis. Polygons indicate the gates for nonculturable cells [PI(+)], dim cells, and lit cells with the proportion of cells in that particular gate. (Bottom) Cumulative distribution of mEos2 florescence intensity in MSM-mEos2 cells, dashed lines indicate boundaries of sort gates for dim, lit, and unselected PI(-) cells. (b) Cultivability of PerSorted dim, lit, and PI(-) cells from ATc-induced MSM-mEos2 cultures. The percent cultivable cells was calculated from the number of CFU from 200 sorted cells. Experiments were performed in triplicates, and error bars represent the standard deviation between replicates. Significance of cultivability difference between dim, lit, and nonculturable subpopulations was calculated with Student’s t test. (c) ScanLag analysis of dim, unselected PI(-), and lit cells from PerSorted MSM-mEos2 cultures induced with ATc (500 ng/ml). The dashed lines in the violin plot indicate mean TOA of the sorted subpopulations. Error bars within the violin plot are standard deviations with a confidence interval of 0.9. (d and e) Percent survival of 5× MIC INH or 5× MIC RIF treatment of PerSorted dim and lit cells of MSM-mEos2 cultures induced with ATc (500 ng/ml), compared to percent survival of whole populations (i.e., unsorted) of MSM-mEos2 induced with ATc (500 ng/ml) and grown in nutrient-rich and starved conditions. Experiments were performed in triplicates, and error bars represent the standard deviation between replicates. Significance of survival between dim and lit subpopulations was calculated with Student’s t test.

