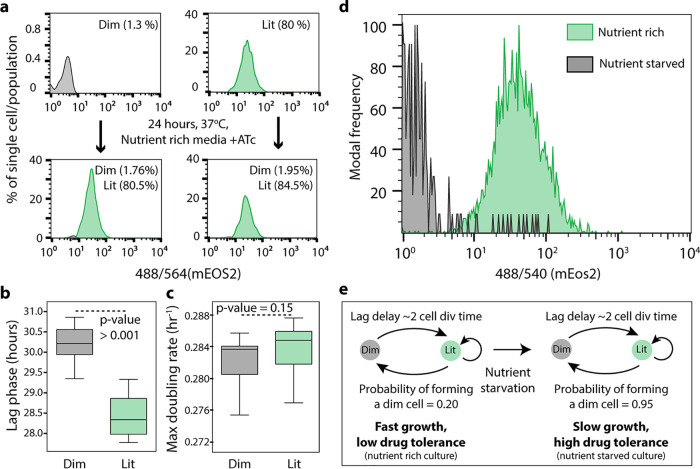
FIG 3.
Regrowth dynamics of PerSorted dim and lit cells and population structure under nutrient-rich versus nutrient-starved conditions. (a) Dim and lit cell proportions in cultures regrown from PerSorted dim and lit populations obtained from ATc-induced MSM-mEos2 cultures. The proportions of cells in each subpopulation were measured from the gating methods described in the legend to Fig. 2a. (b and c) Lag phase and maximum growth rate were calculated from OD600 absorbance measurements of dim and lit cells PerSorted into 7H9 medium. Error bars were calculated by measuring standard deviations in the lag phase and maximum growth rates between dim and lit cells (n = 100,000). Significance of differences between dim and lit subpopulations was calculated with Student’s t test. (d) Population structure of ATc-induced MSM-mEos2 cultures grown in nutrient-rich (green) and nutrient-starved (gray) conditions. (e) A model describing the formation of dim cells under nutrient-rich and nutrient-starved conditions in mycobacterium. The probability of dim cell formation was calculated from their relative proportion in the indicated culture conditions.

