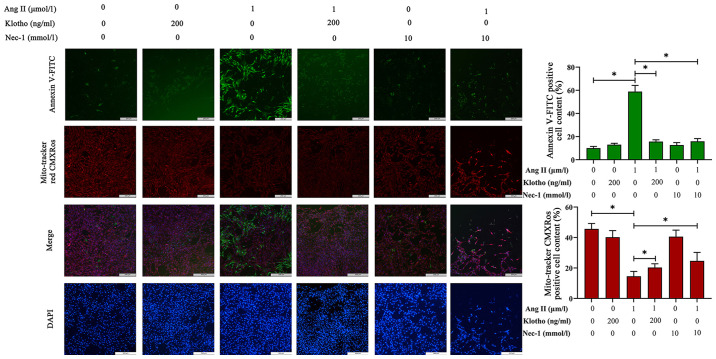
Figure 4.
Mitochondrial membrane potential and apoptosis were detected with MitoTracker Red CMXRos and Annexin V-FITC. Green fluorescence indicates cellular apoptosis by Annexin V-FITC staining and red fluorescence reveals mitochondrial membrane potential by Mito-Tracker Red CMXRos staining. Blue fluorescence indicates nuclei stained with DAPI. Green fluorescence increased with the treatment of Ang II and was alleviated when pretreated with Klotho protein and Nec-1 which indicated that apoptosis increases with Ang II treatment. Red fluorescence demonstrated an inverse relationship with green fluorescence. *P<0.05. Ang II, angiotensin II.

