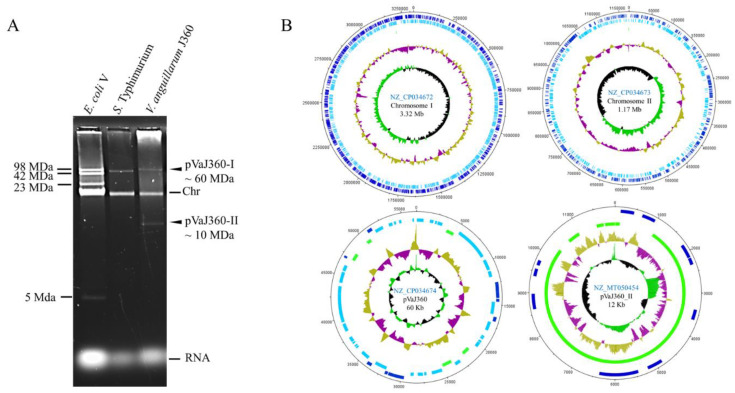
Figure 3.
V. anguillarum J360 genome visualization. (A) V. anguillarum J360 plasmid profile in 0.5% agarose using nucleic acids alkaline extraction; E. coli V and S. Typhimurium UK-1 (χ3761) were used as markers; Chr: Chromosomal band. (B) Genome map of V. anguillarum strain J360. Chromosome I, chromosome II, large plasmid pVaJ360-I (~60 MDa), and small plasmid pVaJ360-II (~10 MDa) were mapped using DNA plotter. Blue bars represent forward genes; light blue bars represent reverse genes; green bars represent pseudogenes and miscellaneous features. Gold (high) and violet (low) represent G + C content percent; green (high G + C) and black (low G + C) represent skew.

