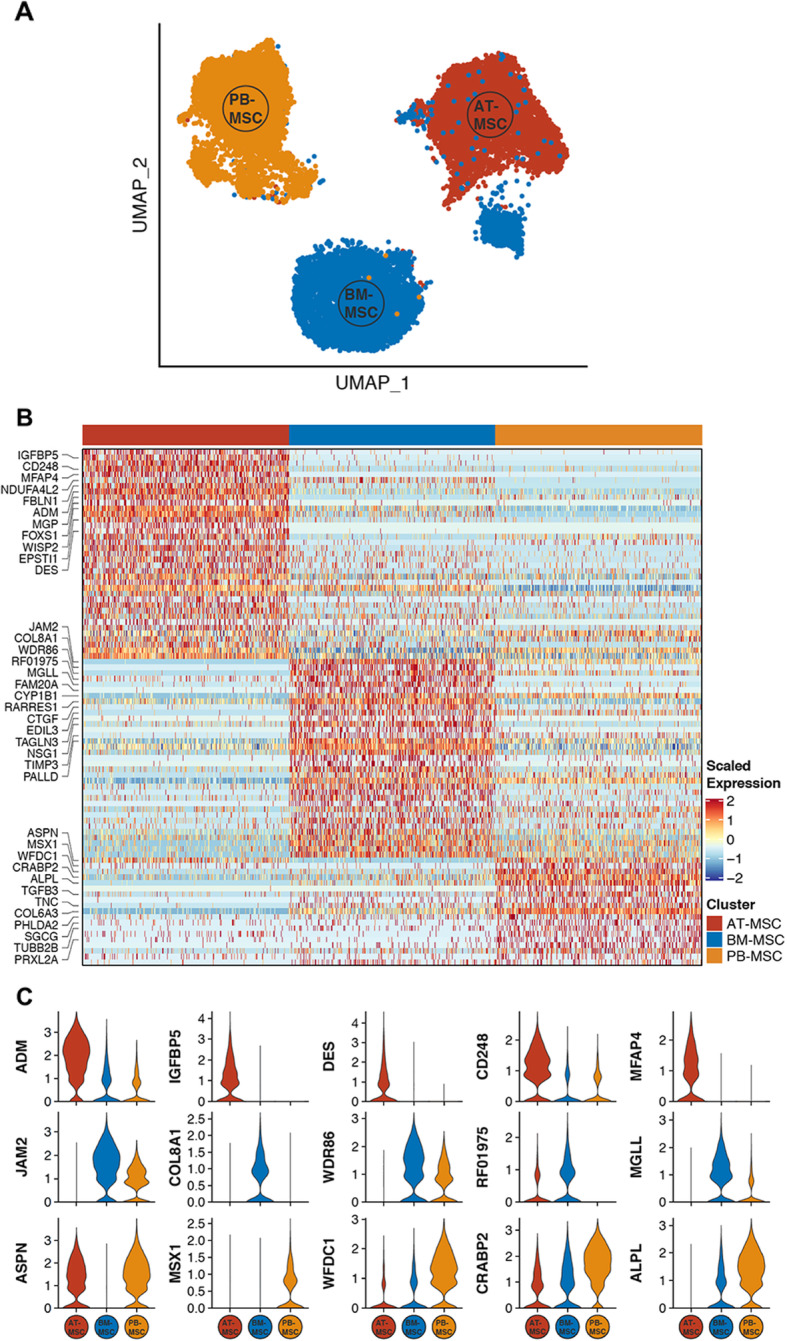
Fig. 2.

Single-cell RNA sequencing (sc-RNAseq) data reveal inter-source variation of equine mesenchymal stromal cells (MSCs). a UMAP plot depicting clustering of MSCs isolated from donor-matched adipose tissue (AT), bone marrow (BM), and peripheral blood (PB). b Heatmap showing significant differentially expressed genes (DEGs) (adjusted p-value < 0.05, log2 fold change > 1 for each tissue source versus all others, percentage of tissue source with detectable expression of gene > 25%) between tissue sources. Top 10 (ranked by log2 fold change) genes per tissue source are labeled with gene symbol. For visualization purposes, 250 cells (columns) were randomly selected from each tissue source. c Violin plots of the expression levels of the top 5 DEGs (ranked by log2 fold change) in MSCs isolated from each tissue source. See also Additional files 1 and 2
