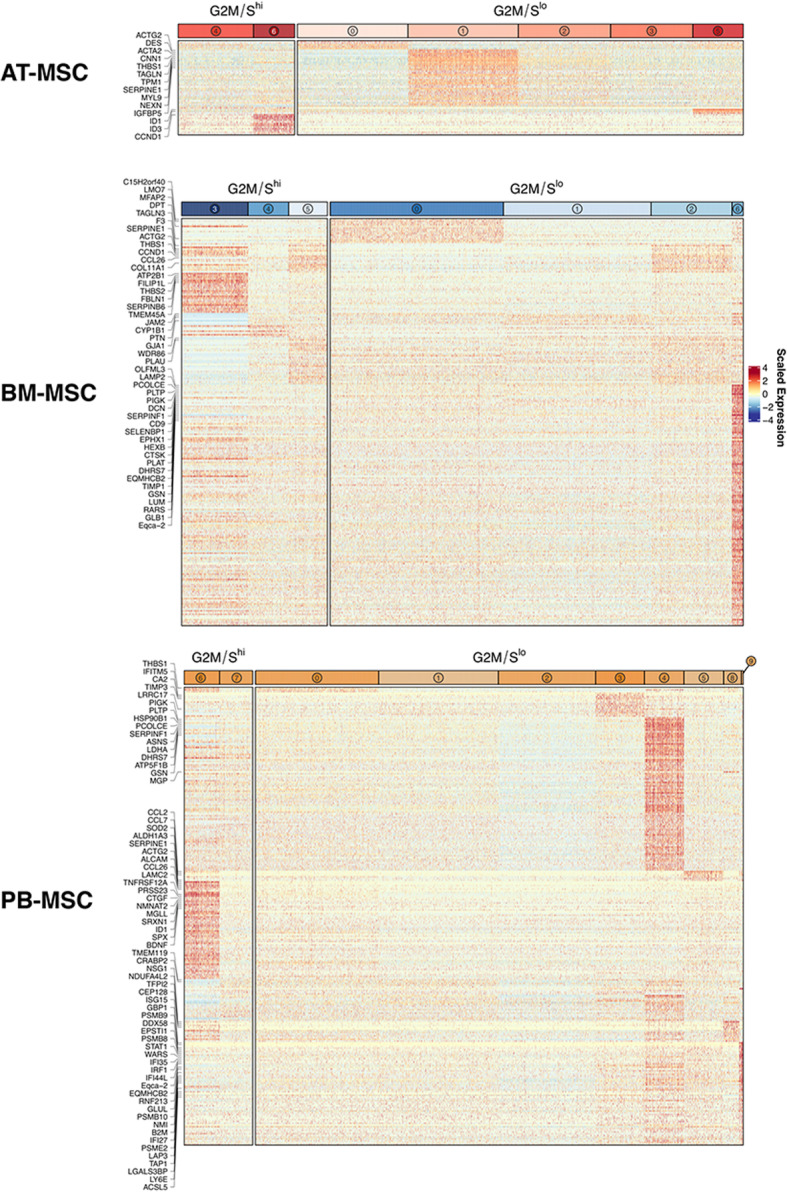
Fig. 5.

Equine mesenchymal stromal cells (MSCs) isolated from 3 donor-matched tissue sources exhibit intra-source transcriptional heterogeneity. Heatmaps of differentially expressed genes (DEGs) (adjusted p-value < 0.05, log2 fold change > 1 for each cluster versus all other clusters within tissue source/cell cycle classification, percentage of cluster with detectable expression of gene > 25) for AT-, BM- and PB-derived MSCs, revealing intra-source transcriptional heterogeneity. Individual heat maps were grouped by cluster cell cycle classification (G2M/Shi and G2M/Slo) / corresponding DGE analysis. DEGs with log2 fold change > 1.5 are labeled with gene symbol
