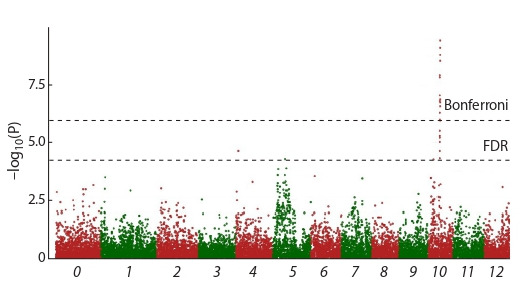
Fig. 1. Manhattan plot showing significant SNP, associated with eye depth when using GLM analysis taking into account the population structure.

1–12 – chromosome designation; 0 – SNPs unassigned to certain chromosomes.

1–12 – chromosome designation; 0 – SNPs unassigned to certain chromosomes.