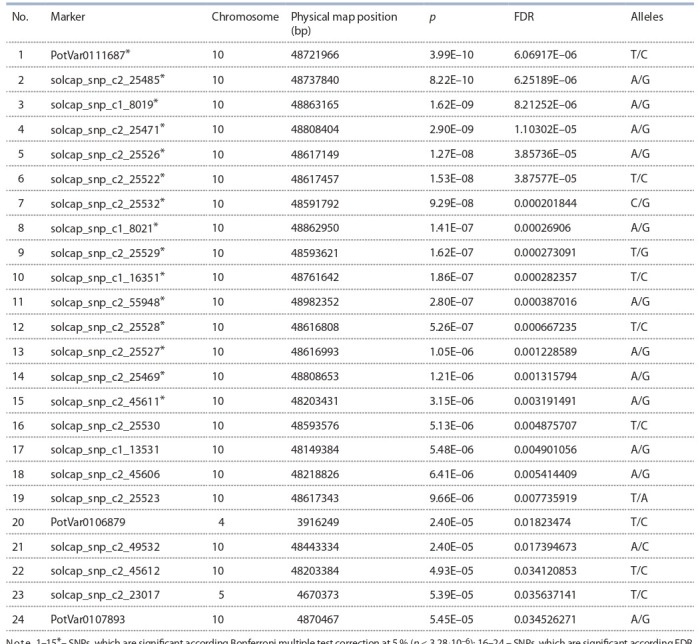
Table 2. SNPs associated with the eye depth, which identified using GLM analysis.

Note. 1–15*– SNPs, which are significant according Bonferroni multiple test correction at 5 % ( p < 3.28·10–6); 16–24 – SNPs, which are significant according FDR.

Note. 1–15*– SNPs, which are significant according Bonferroni multiple test correction at 5 % ( p < 3.28·10–6); 16–24 – SNPs, which are significant according FDR.