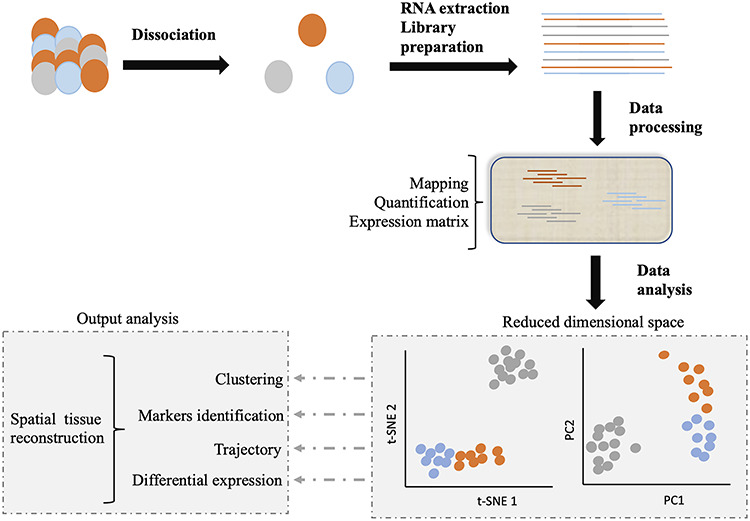
Figure 1.

Schematic representation of scRNA-Seq. After dissociation of the sample of interest (e.g. a tissue), the mRNA content of each individually selected cell is transformed into a sequencing library. The reads of each single cell are identified by a barcode, introduced during the library construction process. Libraries are then pooled and sequenced together. For processing, the data are demultiplexed, mapped and quantified, and a count matrix is generated. Analysis of this matrix can allow to cluster per cell type, assign markers to these cell types, track cells through biological processes or detect differences in gene expression. When experimental design allows, the spatial organization of the starting tissue can be reconstructed. Image adapted from Lafzi et al. [6].
