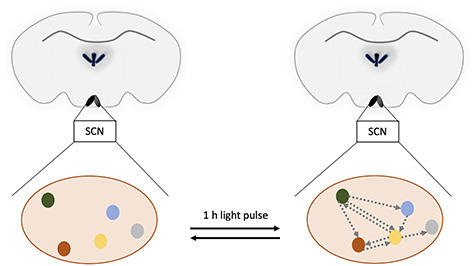
Figure 4.

Increased communication between the subregions of the SCN after a light pulse. The different colored dots represent different subregions of the SCN expressing different neurotransmitters and receptors (red, VIP neurons; yellow, AVP neurons; green, PACAP and prokineticin 2 neurons; blue, PACAP and probably gastrin-releasing peptide neurons; gray, less defined, responsive cluster). Gray arrows symbolize the flow of neurotransmitters between the different cell clusters. Note that the figure displays only a snapshot of the situation 1 h after the light pulse and the process is probably highly dynamic.
