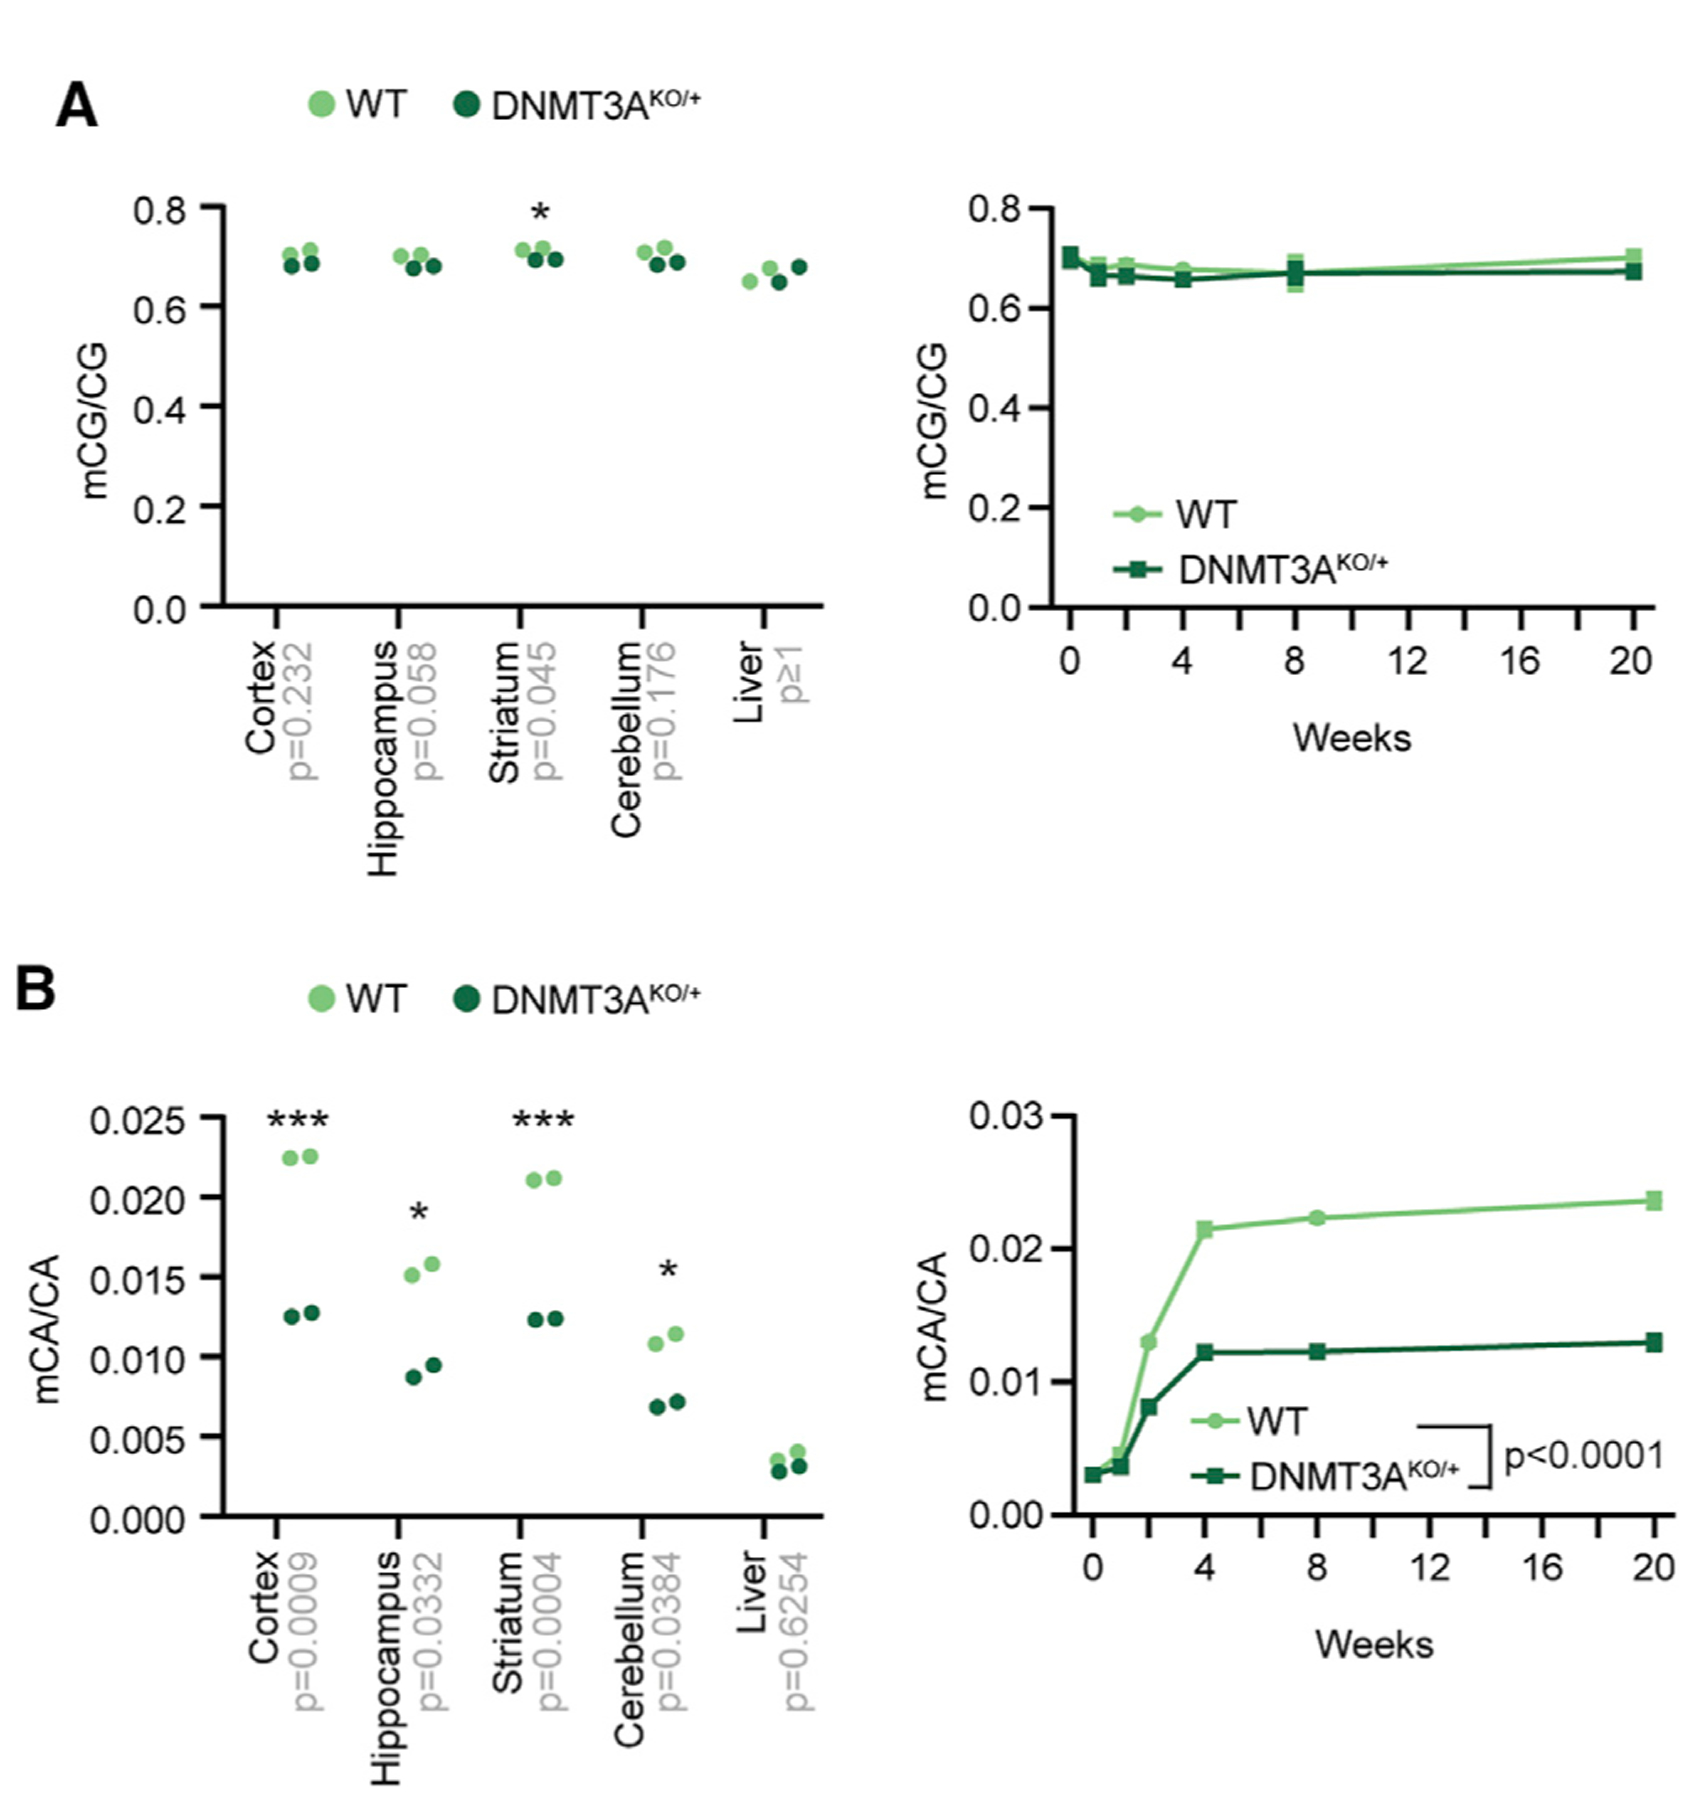
Figure 4. Global DNA Methylation Levels upon Heterozygous Loss of DNMT3A.

(A and B) Global mCG (A) and mCA levels (B) in DNA isolated from brain regions of 8-week-old mice (left) (unpaired t test with Bonferroni correction) and developmental time course of global mCG in the cerebral cortex (right), as measured by sparse whole-genome bisulfite sequencing (WGBS) (p < 0.0001 effect by genotype, F(1,27) = 1024; p < 0.0001 effect by age F(5,27) = 884.6; n = 3–4; two-way ANOVA). Bonferroni corrected p values are indicated on the x axis. *p < 0.05, ***p < 0.001. Line graphs indicate mean and SEM. See also Figure S6.
