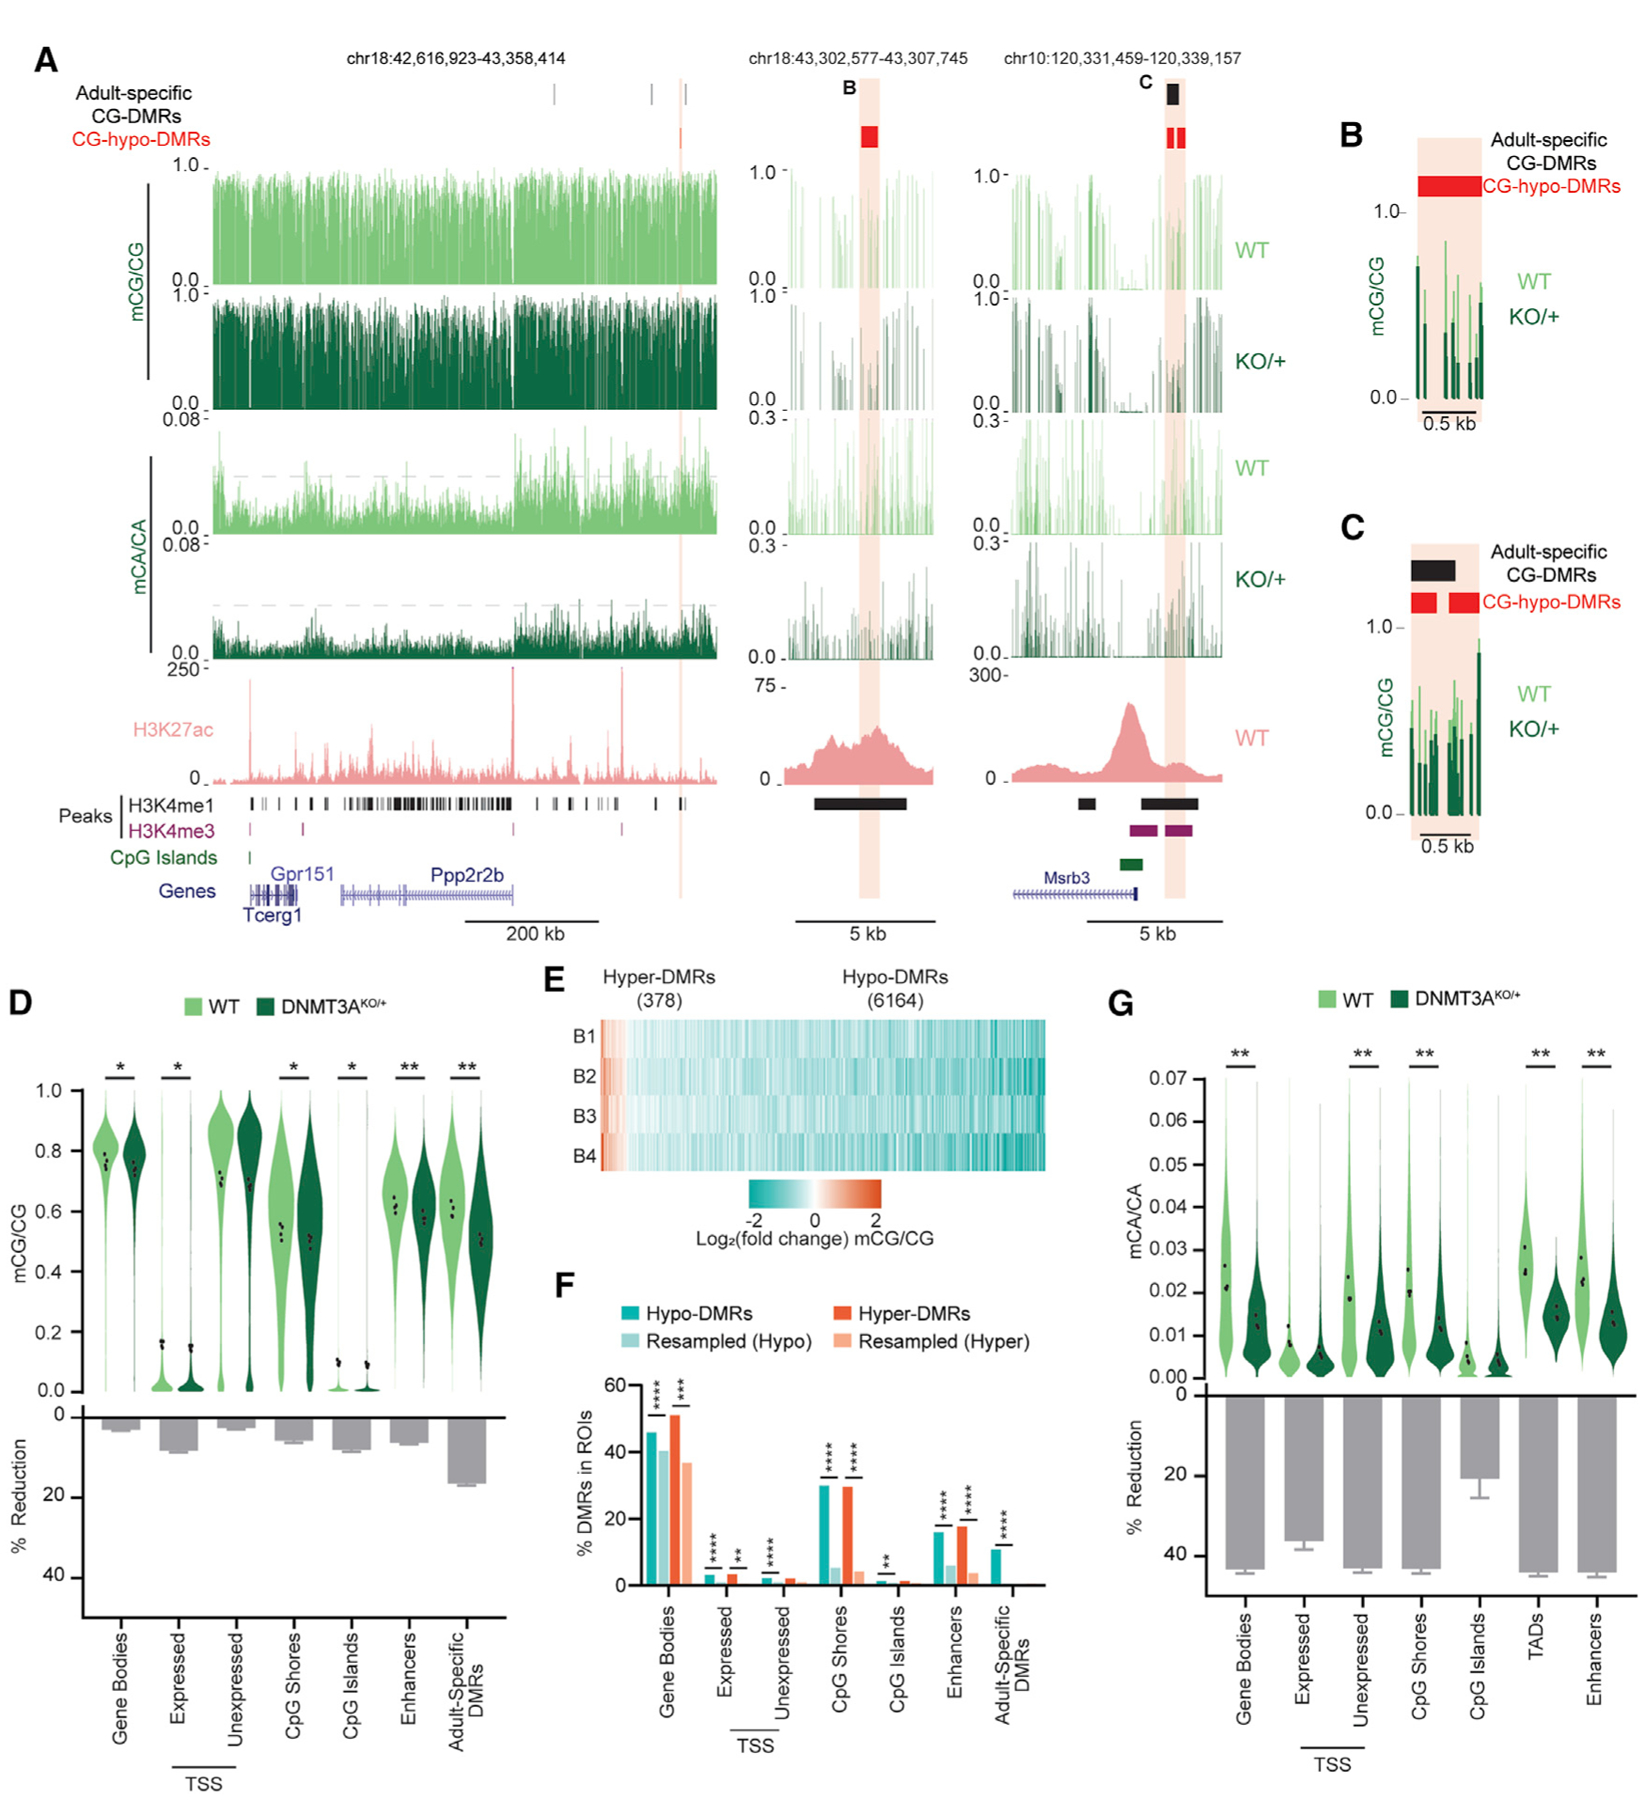
Figure 5. High-Resolution Analysis of DNA Methylation Changes in the DNMT3AKO/+ Cerebral Cortex.

(A) Genome browser views of mCA and mCG in WT and DNMT3AKO/+ cerebral cortices, measured by WGBS. A broad view shows global reduction in mCA (left). A gray dashed line facilitates comparison of mCA levels across genotypes. Shown is magnification of DNMT3AKO/+ hypo-CG-DMRs overlapping an enhancer (center) or a CpG-island shore and an adult-specific DMR (right). A WT H3K27ac ChIP-seq signal (Clemens et al., 2019), peaks of enhancer-associated histone H3 lysine 4 methylation (H3K4me1) and promoter-associated histone H3 lysine 4 tri-methylation (H3K4me3) (Stamatoyannopoulos et al., 2012), CpG islands, and gene annotations (Haeussler et al., 2019) are also shown.
(B and C) Overlay of the mCG signal for DMRs shown in (A).
(D) Violin plot of mCG/CG levels (top) and percent reduction (bottom) in DNMT3AKO/+ versus WT across genomic regions. Dots indicate mean mCG/CG per bioreplicate (n = 4 per genotype; paired t test, Bonferroni correction).
(E) Heatmap of CG-DMRs called in the DNMT3AKO/+ cortex across bioreplicates (B1–B4).
(F) Overlap of CG-DMRs with genomic regions (Fisher’s exact test, observed versus background estimated from resampled DMRs; STAR Methods).
(G) Violin and percent reduction plots as in (D) but for mCA/CA.
*p < 0.05, **p < 0.01, ***p < 0.001, ****p < 0.0001. Bar graphs indicate mean and SEM. See also Figure S6.
