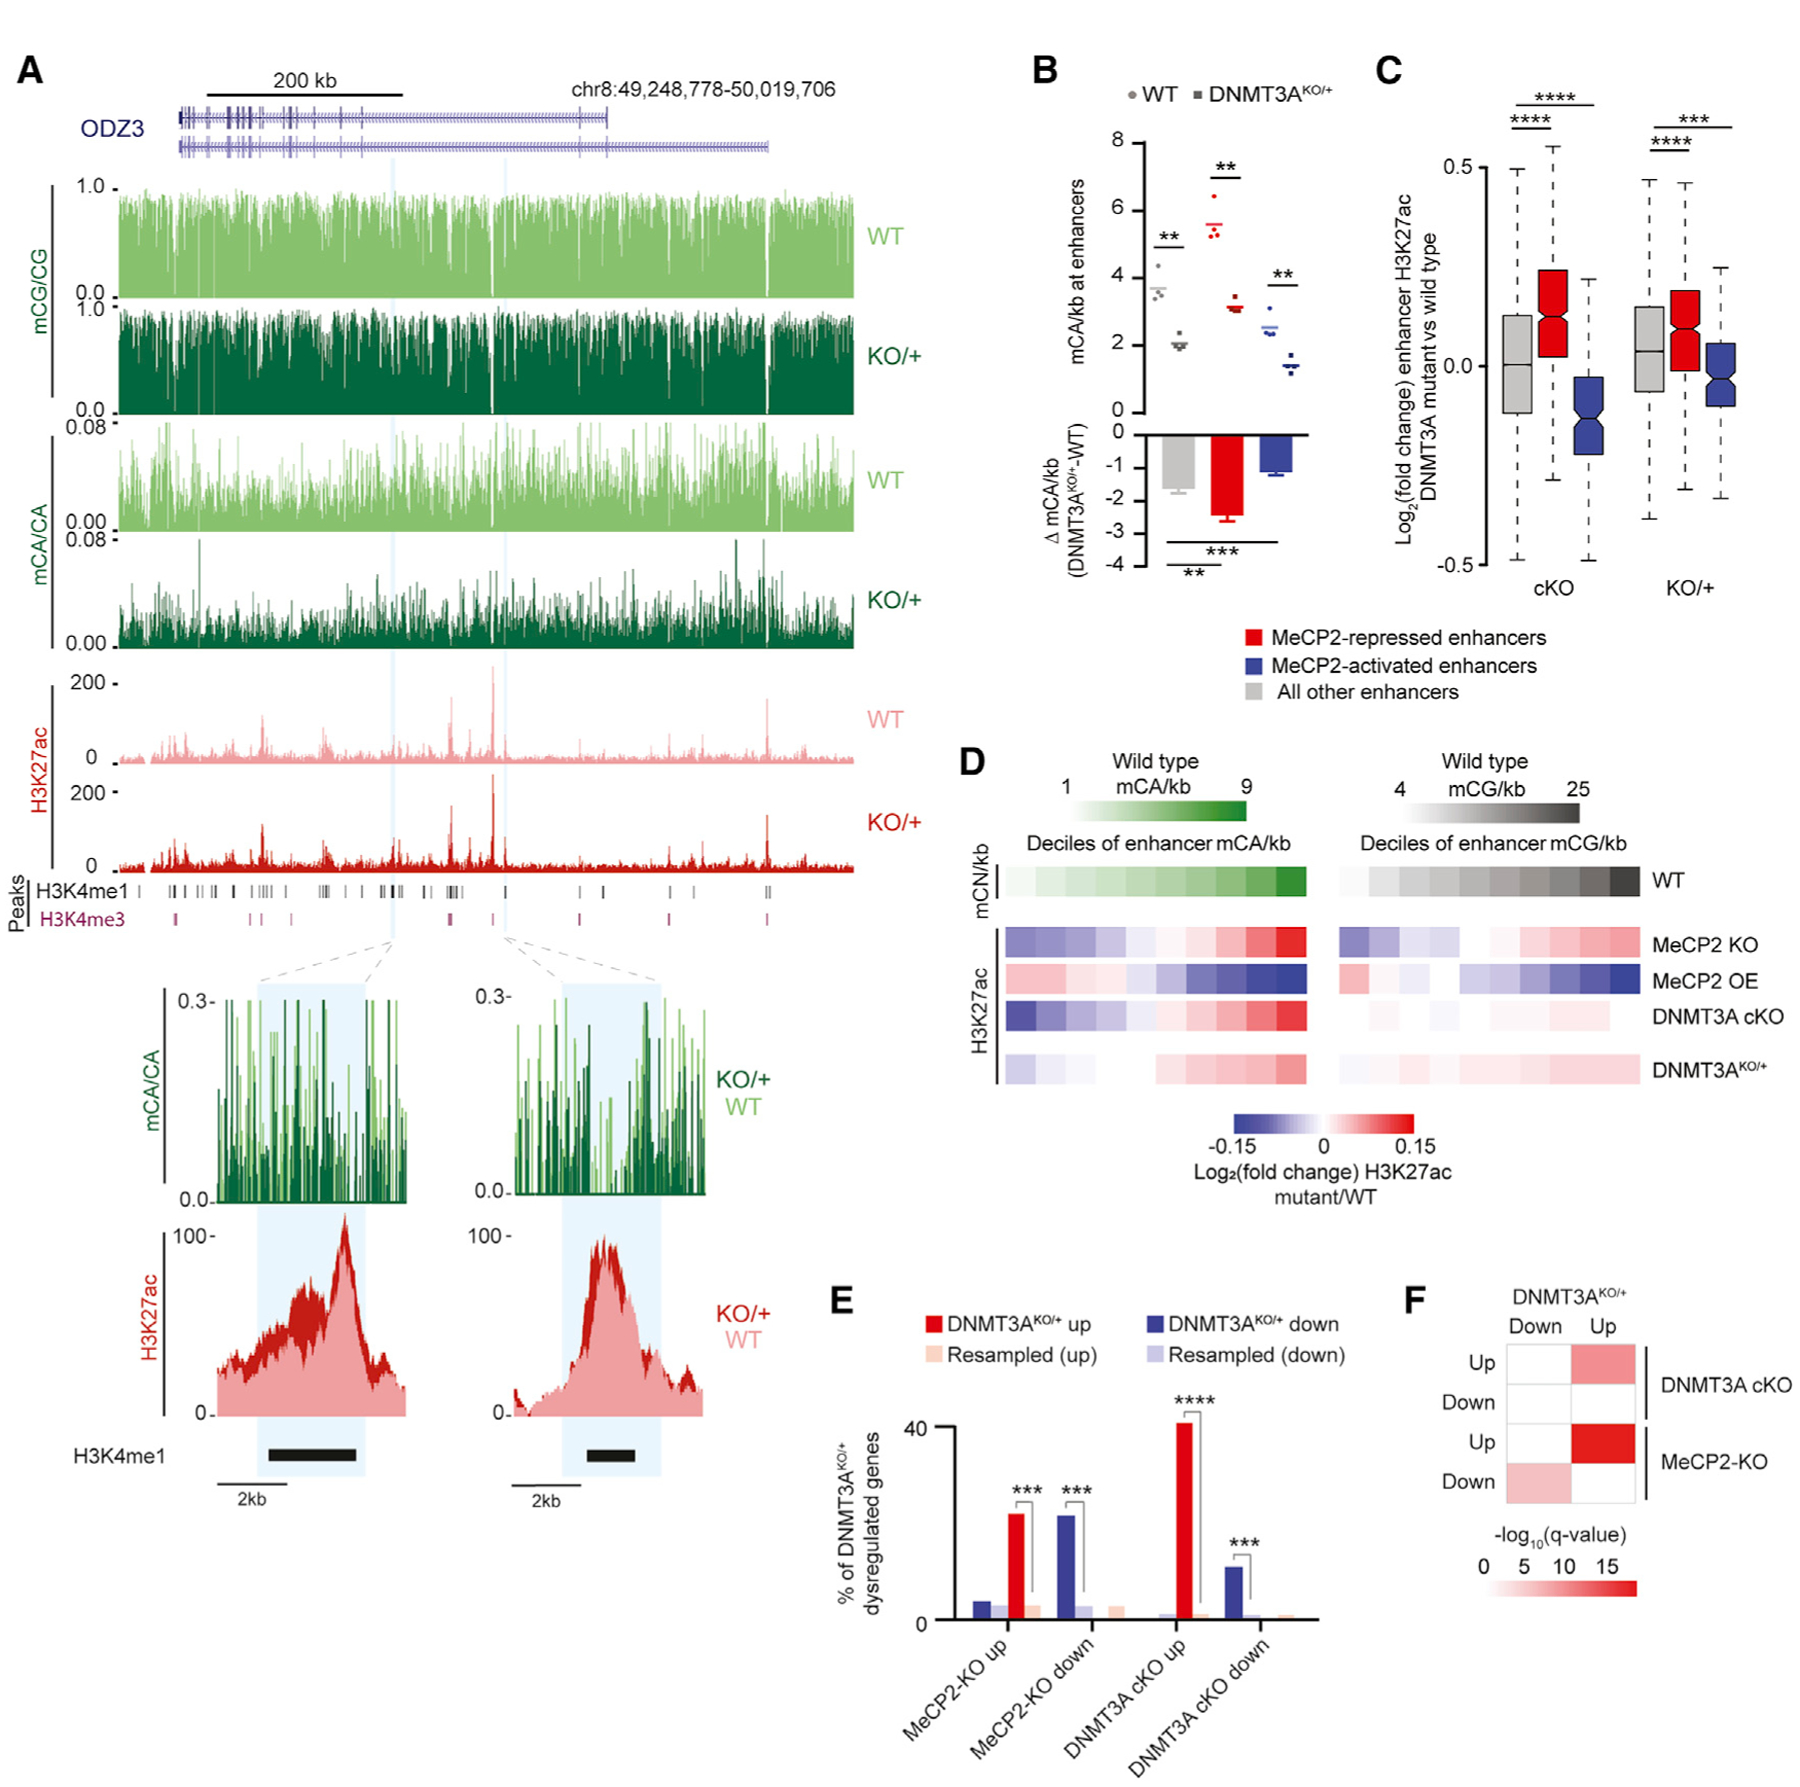
Figure 6. Epigenetic and Transcriptomic Dysregulation in the DNMT3AKO/+ Cerebral Cortex Overlaps with MeCP2 Mutants.

(A) Genome browser view of DNA methylation and H3K27ac ChIP-seq data from WT and DNMT3AKO/+ (top). Shown are an overlaid H3K27ac signal and mCA/CA at enhancers defined previously as dysregulated upon disruption of mCA or MeCP2 (Clemens et al., 2019) (bottom).
(B) Mean mCA sites per kilobase in WT and DNMT3AKO/+ (top) and mCA sites per kilobase lost in DNMT3AKO/+ (bottom) for enhancers significantly dysregulated in MeCP2 mutants (**p < 0.01, ***p < 0.001; n = 4; paired t test with Bonferroni correction).
(C) Boxplot of change in H3K27ac signal in DNMT3A Baf53b-cKO and DNMT3AKO/+ for enhancers defined as significantly dysregulated in MeCP2 mutants (***p < 10−8, ****p < 10−12; n = 5 bioreplicates; Wilcoxon test).
(D) Heatmap of H3K27ac changes for mutants across deciles of enhancers sorted by WT mCA or mCG sites per kilobase.
(E) Overlap of significantly dysregulated genes (padj. < 0.1) in DNMT3AKO/+ and genes dysregulated in DNMT3A Baf53b-cKO or MeCP2 mutants (***p < e−5, ****p < e−10; hypergeometric test, observed versus background estimated by resampling; STAR Methods).
(F) Significance of gene set expression changes in DNMT3AKO/+ for GAGE analysis of gene sets dysregulated in DNMT3A Baf53b-cKO or MeCP2 mutants (Clemens et al., 2019). Boxplots indicate median and quartiles. Bar graphs indicate mean and SEM.
See also Figures S6 and S7.
