
Figure 3.
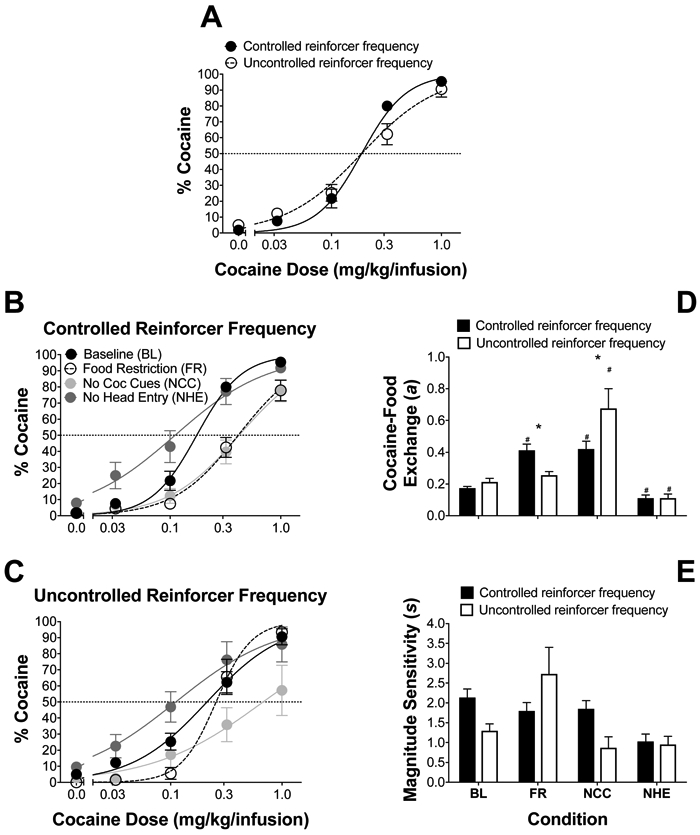
Effects of environmental manipulations on cocaine preference. (A) Mean (±SEM) percent choice for cocaine under the controlled and uncontrolled reinforcer frequency choice procedures at baseline; n = 20/procedure. (B) Mean (±SEM) percent choice for cocaine under controlled reinforcer frequency at baseline (BL), food restricted (n = 14), no cocaine cues (NCC; n = 15), and no head-entry orienting response conditions (NHE; n = 12). (C) Mean (±SEM) percent choice for cocaine under uncontrolled reinforcer frequency for baseline (BL), food restricted (FR; n = 11), no cocaine cues (NCC; n = 10), and no head entry conditions (NHE; n = 9). Best-fit parameter estimates from nonlinear-mixed-effects generalized matching fits (Equation 2), namely (D) cocaine-food exchange and (E) sensitivity to relative cocaine-food magnitude under the different schedules and conditions. * indicates p <0.05 between schedule and # indicates p <0.05 versus baseline. Lines are best fits of Equation 2 determined by nonlinear-mixed-effects analysis.