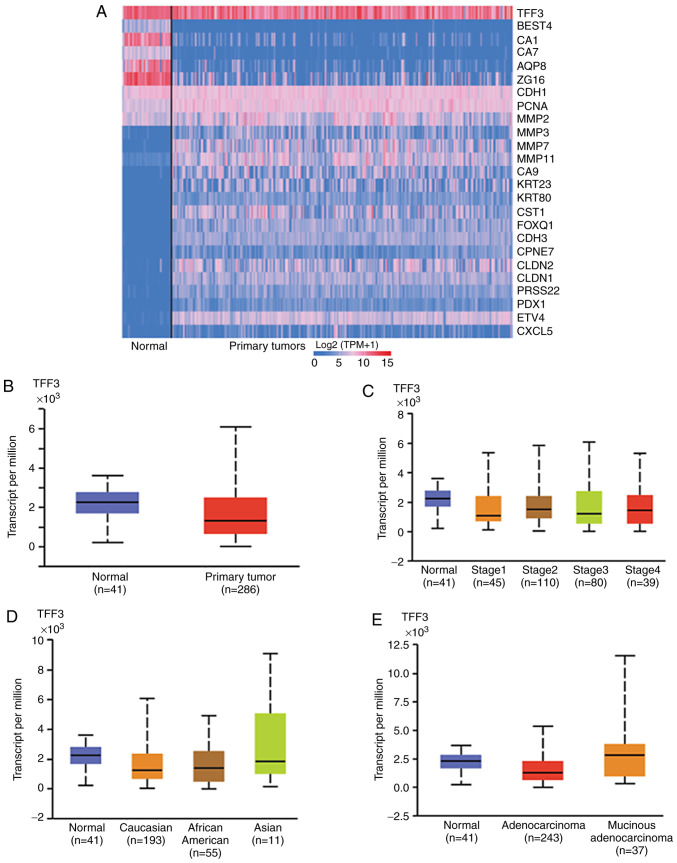
Figure 1.
TFF3 RNA expression in CRC tissues. (A) Heat-map plot of 25 differentially expressed genes in CRCs and normal colonic tissue from TCGA dataset generated by web-portal UALCAN. (B) Box plots showing relative expression of TFF3 mRNA in CRC and normal tissues (Student's t-test). The mRNA expression levels were normalized as transcripts per million reads. (C) The expression of TFF3 for various stages of CRC and normal colon. (D) TFF3 expression in CRCs on the basis of patient race and (E) tumor histologic types (C-E, one-way ANOVA with Dunnett's multiple comparisons test). Pairwise comparisons relative to normal tissue. CRC, colorectal cancer; TFF3, trefoil factor 3; TCGA, The Cancer Gene Atlas.

