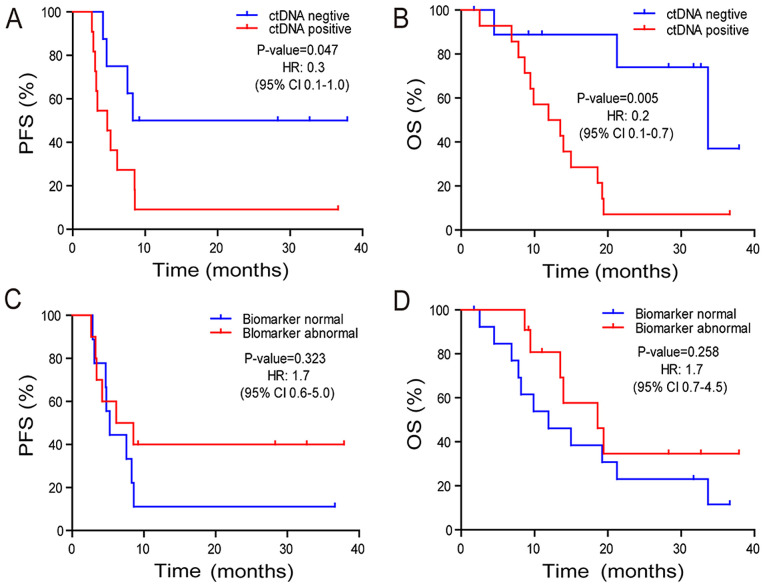
Figure 2.
PFS and OS times of patients stratified by post-radiation ctDNA or tumor biomarker status. Kaplan-Meier plots of (A) PFS and (B) OS times in patients with ESCC and treated with radiation therapy stratified by ctDNA status in the initial post-radiation plasma samples. Kaplan-Meier plots of (C) PFS and (D) OS times in patients with ESCC and treated with radiation therapy stratified by clinical biomarker status in the initial post-radiation plasma samples. PFS, progression free survival; OS, overall survival; ct, circulating tumor; ESCC, esophageal squamous cell carcinoma; HR, hazard ratio.

