Figure 2.

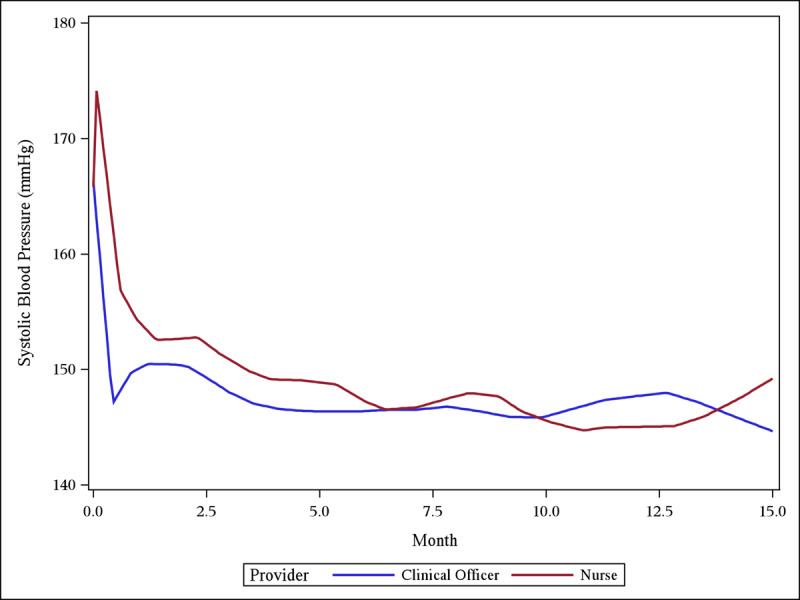
Loess plot of mean SBP over time, demonstrating early reduction in SBP in both the nurse and clinical officer groups, maintained during the follow-up period.

Loess plot of mean SBP over time, demonstrating early reduction in SBP in both the nurse and clinical officer groups, maintained during the follow-up period.