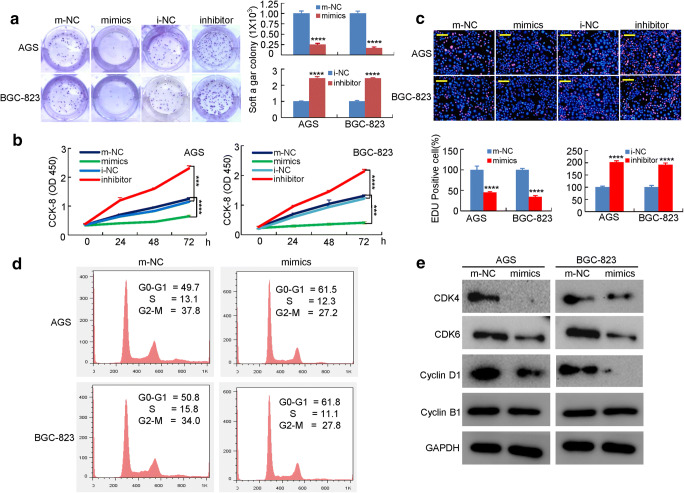
Fig. 2.
MiR-4490 suppresses GC cell growth in vitro. (a) Representation (left) and quantification (right) of colony formation assay showing the growth of GC cells transfected with NC or miR-4490 mimics or inhibitors. ****, p < 0.001. (b) The proliferation of miR-4490 mimic-transfected GC cells is lower compared with the corresponding m-NC-transfected cells, and downregulation of miR-4490 reverses this effect. ***, p < 0.01; ****, p < 0.001. (c) The EdU-positive cell rate is decreased after miR-4490 mimic transfection, whereas miR-4490 inhibitor-treated GC cells show a higher proliferation rate. ****, p < 0.001. (d) Flow cytometric analysis of the effect of miR-4490 on GC cell cycle progression; the percentages in G0-G1, S and G2-M phase GC cells were quantified. The figures are representative of three independent experiments. (e) Protein expression detected by Western blotting. Scale bars, 100 μm in C

