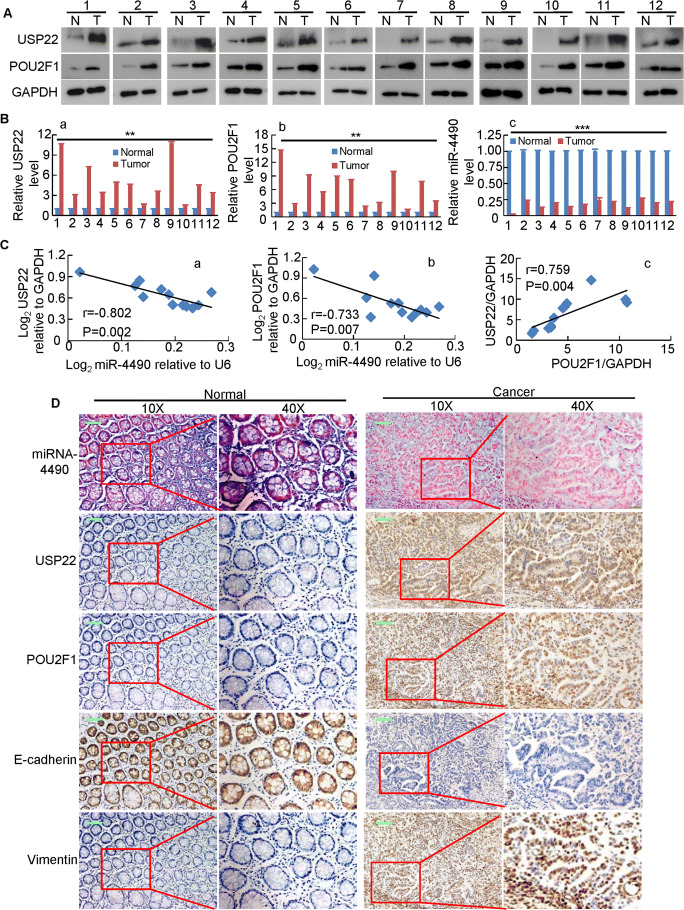
Fig. 7.
Identification of a POU2F1/miR-4490/USP22 axis in primary human GC samples. (a) USP22 and POU2F1 protein levels detected by Western blotting in 12 paired GC tissues; GAPDH was used for normalization. (b) Average tumor/adjacent normal gastric epithelium (N/T) ratios of USP22 (a) POU2F1 and (b), miR-4490 expression quantified by qRT-PCR and normalized against GAPDH or U6 (n = 12). **, p < 0.05; ***, p < 0.01. (c) Correlation between miR-4490 and USP22 expression, between miR-4490 and POU2F1 expression, or between USP22 and POU2F1 expression in 12 GC tissues. (d) MiR-4490, USP22, POU2F1, E-cadherin, and Vimentin expression patterns in human GC tissues and normal adjacent epithelial tissues determined by in situ hybridization (ISH) or IHC staining. Scale bars, 50 μm

