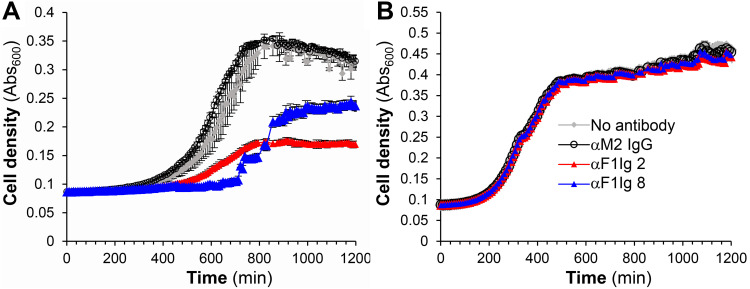
Figure 5.
Effect of antibodies on Yersinia pestis. F1–positive Yersinia pestis (A) and F1–negative Yersinia pseudotuberculosis (B) growth was monitored by densitometry (Abs600) for 20 hours in the absence (gray) or the presence of F1–specific αF1Ig 2 (red), αF1Ig 8 (blue), or negative-control antibody αM2Ig (black) at a final concentration of 340 nM. Each point represents the average of three measurements with corresponding standard deviation (error bar).

