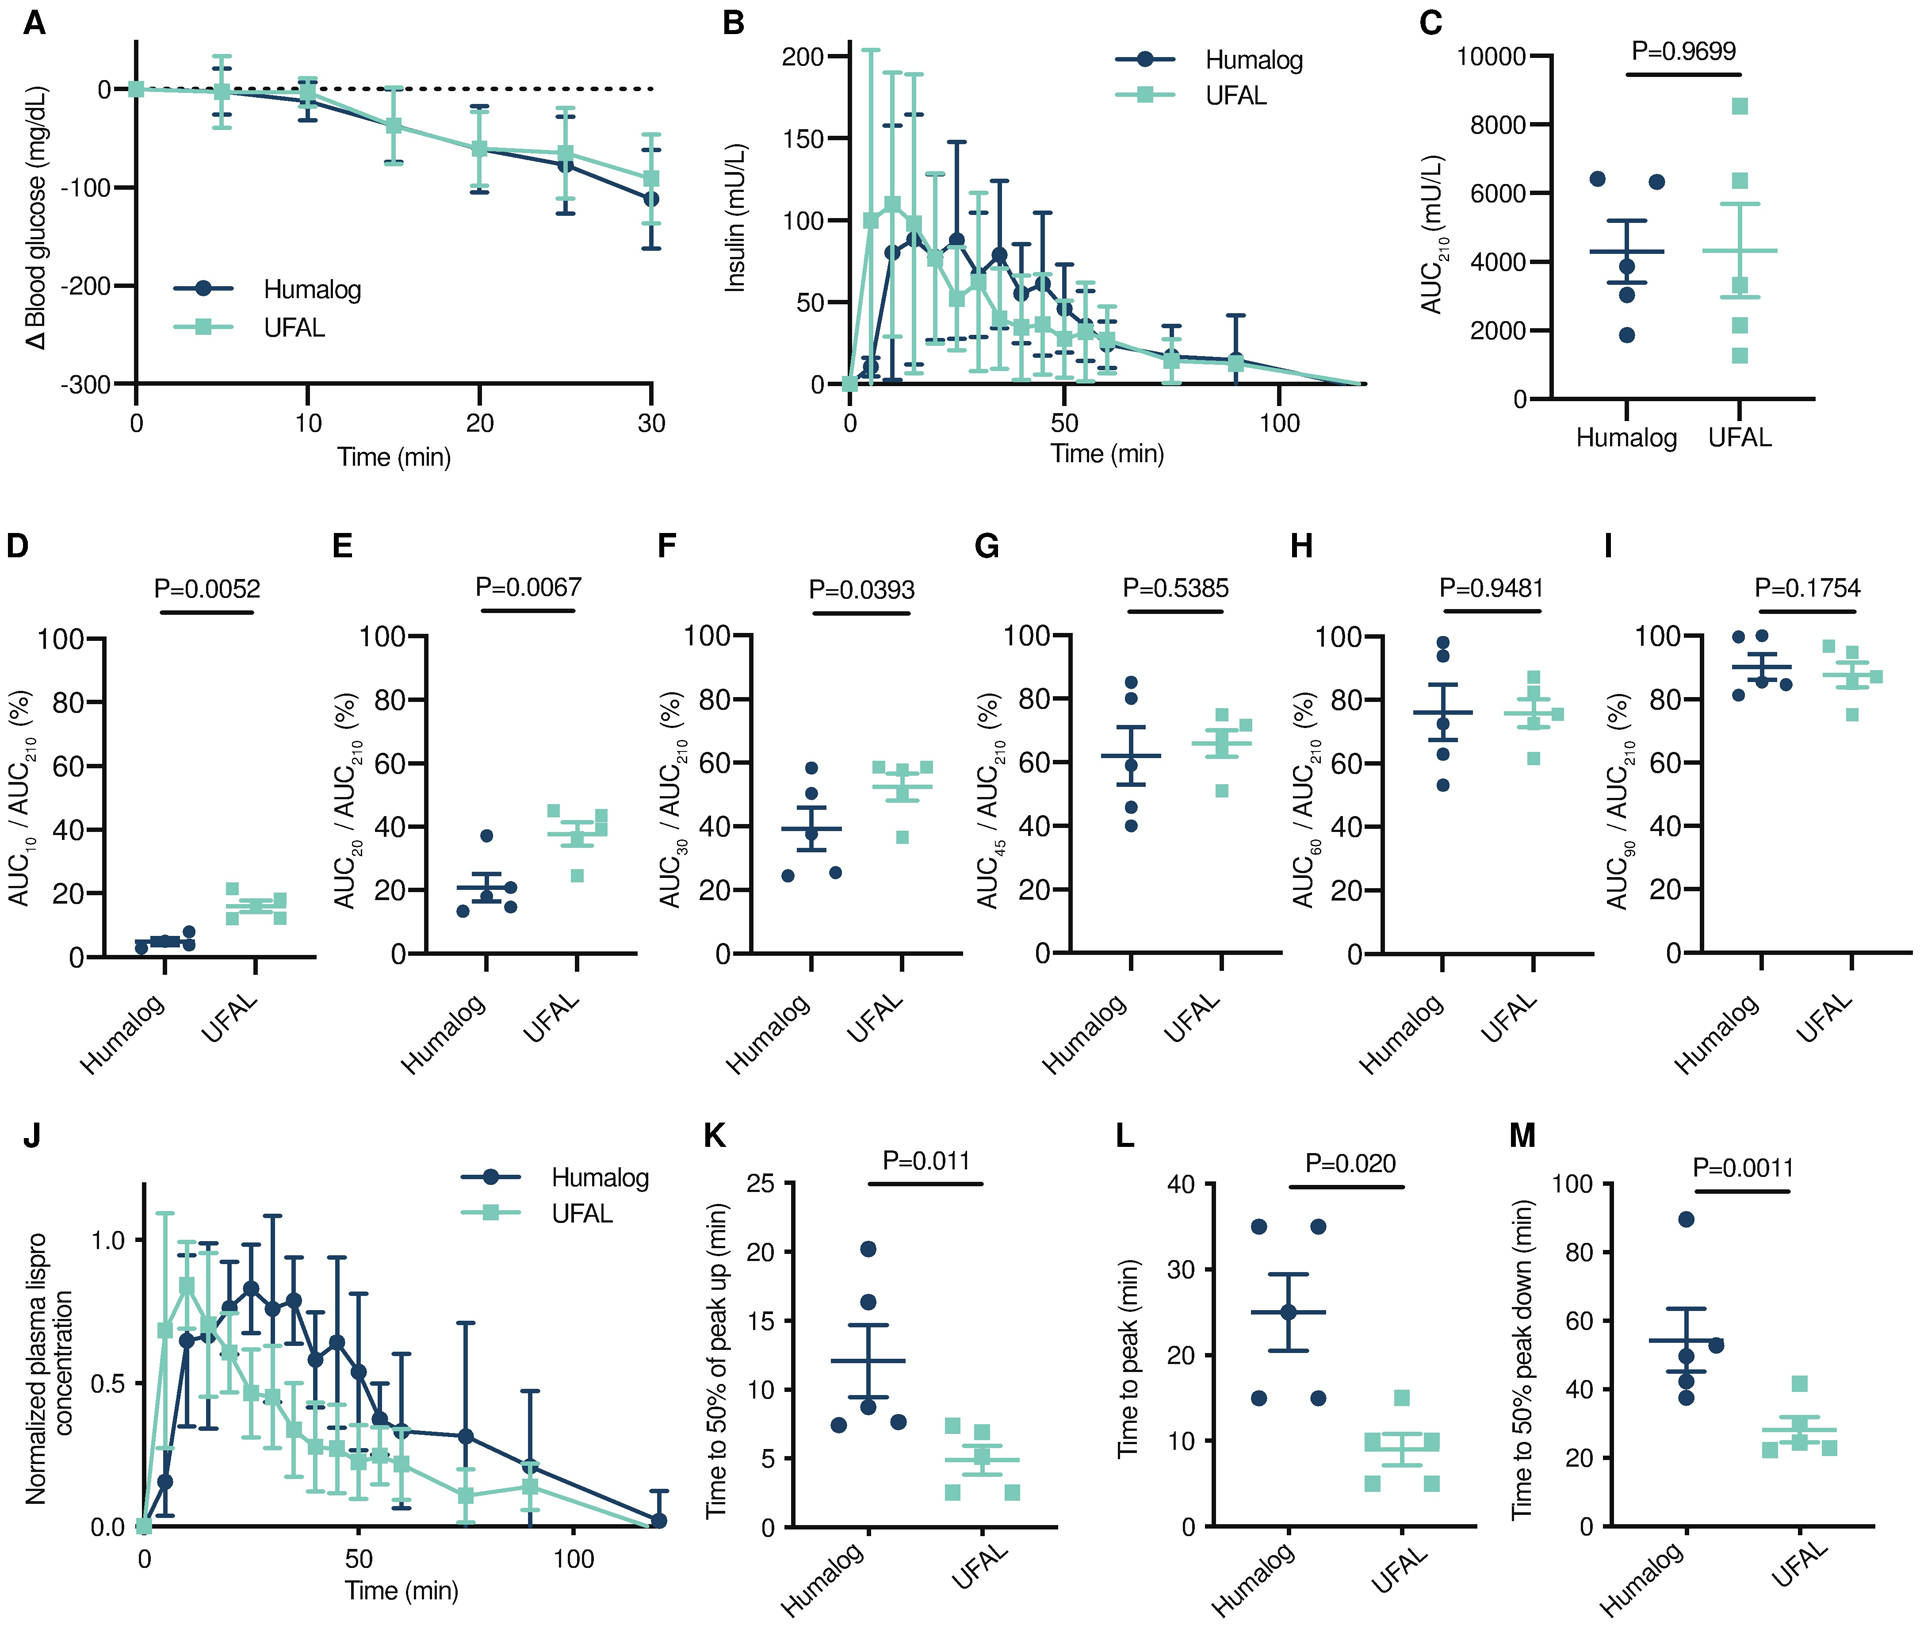
Fig. 5. Pharmacokinetics and pharmacodynamics of monomeric insulin in diabetic pigs.

Diabetic female pigs received subcutaneous administration of therapies comprising either commercial Humalog or UFAL formulated with polymer. Pigs were dosed with insulin according to their individual insulin sensitivities to decrease their blood glucose by about 200 mg/dL. (A) Blood glucose measurements in pigs after insulin dosed subcutaneously. (B) Pharmacokinetics of insulin lispro in mU/L following s.c. injection. (C) Total exposure represented by area under the curve for 210 minutes. (D-I) Percent exposure at various time points (AUCt/AUC210). (J) Pharmacokinetics for each pig were individually normalized to peak concentrations and normalized values were averaged for lispro concentration for each treatment group. (K) Time to reach 50% of peak lispro concentration (onset). (L) Time to reach peak lispro concentration. (M) Time for lispro depletion to 50% of peak concentration. (A,B,J) Error bars indicate mean ± s.d. with n=5 for all groups. (D-I) Error bars indicate mean ± s.e.m. with n=5 for all groups. Bonferroni post-hoc tests were performed to account for comparisons of multiple individual exposure timepoints and significance and alpha was adjusted (alpha = 0.008). (C, K-M) Error bars indicate mean ± s.e.m. with n=5 for all groups (alpha=0.05). Statistical significance was determined by restricted maximum likelihood (REML) repeated measures mixed model.
