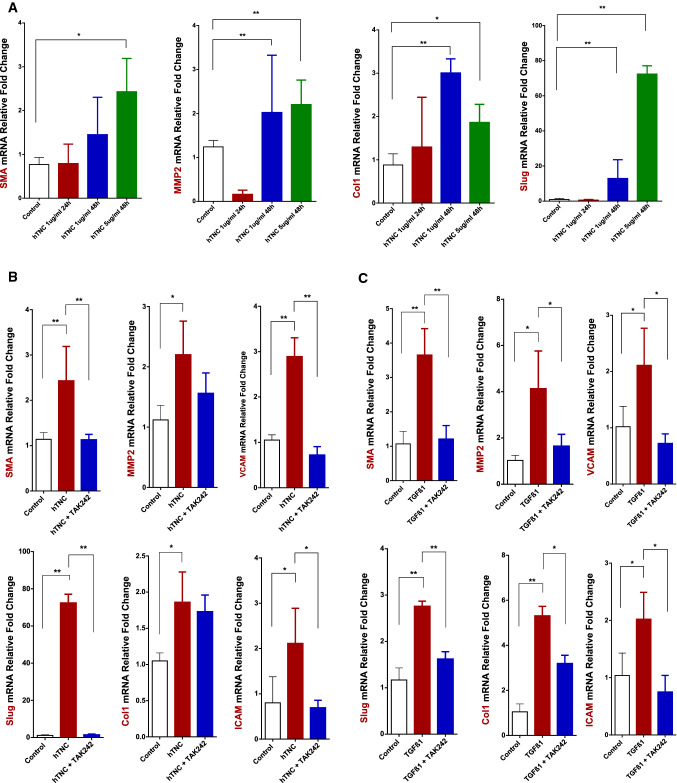
Fig. 6.
TNC and TLR4 influence on EMT induction in MVEC. αSMA, MMP2, Collagen1, and Slug mRNA expression levels measured by RT-qPCR in MVEC treated with different hTNC concentrations (1 and 5 µg/ml) and harvested after 24 or 48 h (n = 5) (a). αSMA, MMP2, VCAM-1, ICAM-1, Slug, and Collagen1 mRNA levels measured by RT-qPCR after pretreatment with TAK242 (50 mM) for 30 min and exposure to hTNC (5 µg/ml for 48 h) (n = 3) (B) or TGFβ1 (1 ng/ml for 96 h) (n = 3) (c). *p < 0.05 **p < 0.001

