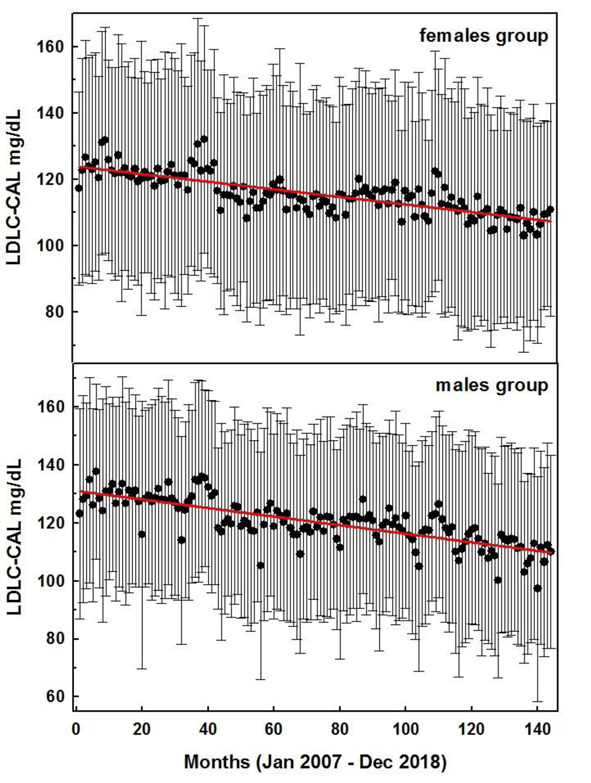
Figure 4.

Monthly averaged LDLC-CAL values for the female (top) and male groups during the 144 months interval between January 2007 and December 2018. Red lines represent the statistical linear regressions (see parameters in Table 1). Error bars represent the corresponding standard deviation
