
Figure 6.
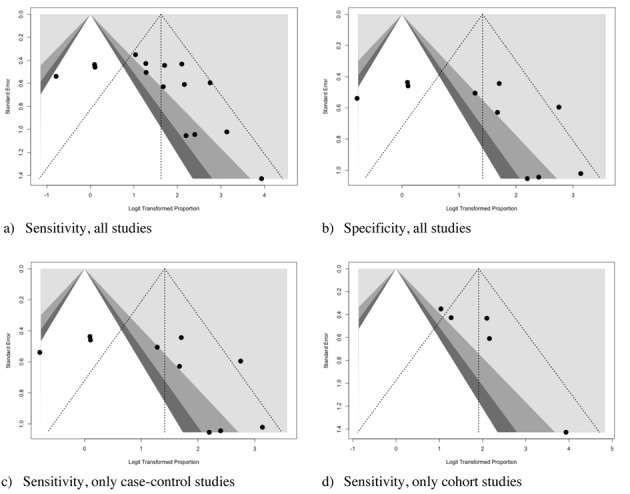
Funnel plots for Sensitivity (a, c, d), and Specificity (d) of studies included in the meta-analysis. Visual inspection suggested a significant asymmetry for all analyses, with subsequent reporting bias. However, regression analysis confirmed a significant reporting bias only for overall analysis of sensitivity (t = 1.8664, df = 13, p value = 0.0847), while it was dismissed for specificity (t = 1.7571, df = 8, p value = 0.117), as well as sensitivity subanalysis both in case-controls (t = 1.7571, df = 8, p value = 0.117) and case-crossover studies (t = 2.3882, df = 3, p value = 0.969), the latter possibly affected by the reduced number of cases included in the analyses