
Figure 7.
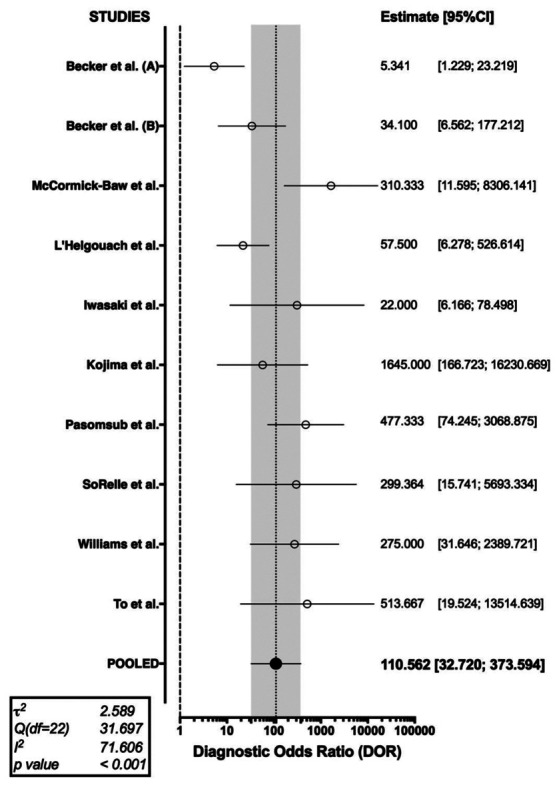
Forest plot representing the pooled diagnostic odds ratio (DOR) of RT-qPCR analysis of salivary fluid for SARS-CoV-2 RNA. A substantial heterogeneity in reported studies was identified (I2 71.61%, Cochran’s Q: 31.697 (df=22, p < 0.001))
Official websites use .gov
A
.gov website belongs to an official
government organization in the United States.
Secure .gov websites use HTTPS
A lock (
) or https:// means you've safely
connected to the .gov website. Share sensitive
information only on official, secure websites.
Forest plot representing the pooled diagnostic odds ratio (DOR) of RT-qPCR analysis of salivary fluid for SARS-CoV-2 RNA. A substantial heterogeneity in reported studies was identified (I2 71.61%, Cochran’s Q: 31.697 (df=22, p < 0.001))