Figure 2.

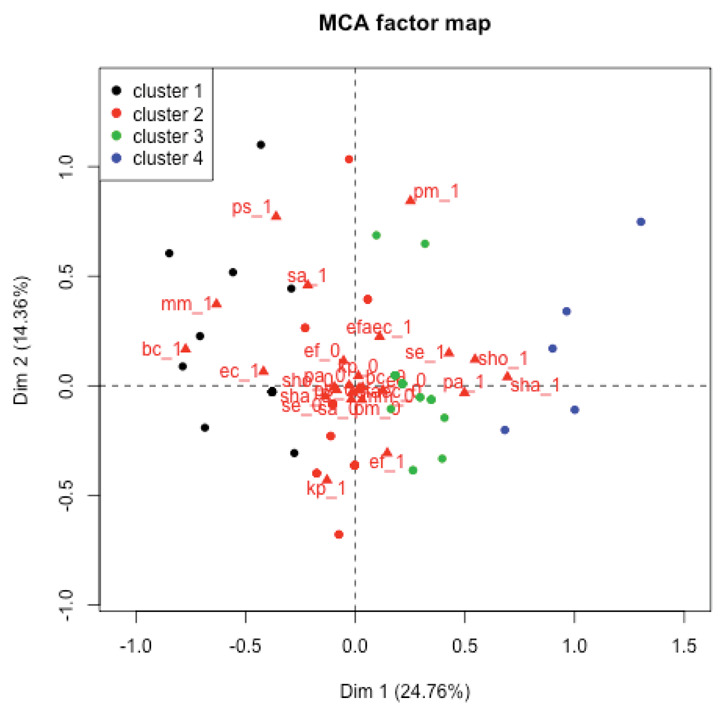
Cluster analysis on the MCA scores. Patients within clusters are projected on the MCA plane and points of patients within the same cluster are represented with the same color.

Cluster analysis on the MCA scores. Patients within clusters are projected on the MCA plane and points of patients within the same cluster are represented with the same color.