Fig. 2.
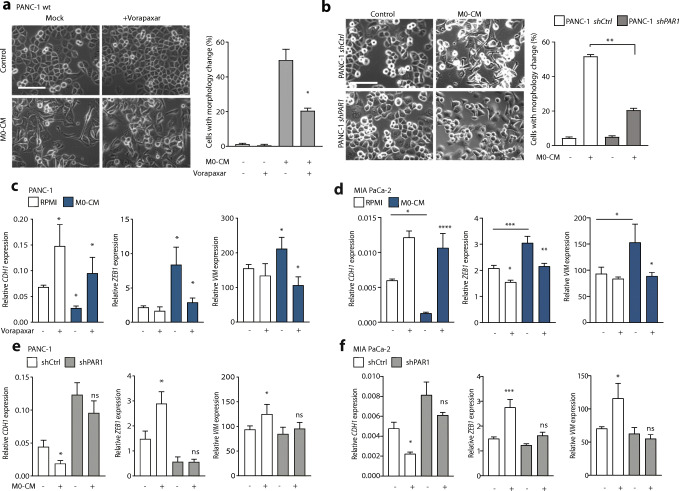
Macrophages induce EMT of pancreatic cancer cells in a PAR1-dependent manner. (A) Phase-contrast microscopic images of PANC-1 wildtype cells treated with control or M0-CM medium. PAR1 was inhibited by Vorapaxar (500 nM) using DMSO as a mock control. Spindle-shaped cells were quantified using the cell counter tool of Image J, after which the percentage per field was calculated according to the total number of cells. Shown is the mean ± SEM (n = 3); Student’s t test. (B) Morphology assessment of shCtrl and shPAR1 PANC-1 cells treated with M0-CM. Spindle-shaped cells were quantified using the cell counter tool of Image J, after which the percentage per field was calculated according to the total number of cells. Shown is the mean ± SEM (n = 3); Student’s t test. In panels A and B, magnification is 20x, and the scale bar indicates 50 μm. (C-D) Relative mRNA expression of CDH1, ZEB1 and VIM in RPMI-1640 (white) or M0-CM (blue) treated PANC-1 (C) and MIA PaCa-2 (D) cells. PAR1 was inhibited by Vorapaxar (500 nM) using DMSO as a mock control. Shown is the mean ± SEM (n = 4); Student’s t test. (E-F) Relative mRNA expression of CDH1, ZEB1 and VIM in RPMI-1640 (−) or M0-CM (+) treated PANC-1 (E) or MIA PaCa-2 (F) shCtrl (white) and shPAR1 (gray) cells. Shown is the mean ± SEM (n = 4); Student’s t test. Relative expression levels, as depicted in panels C-F, were calculated using the comparative threshold cycle (dCt method) and normalized to the expression of the reference gene TBP

