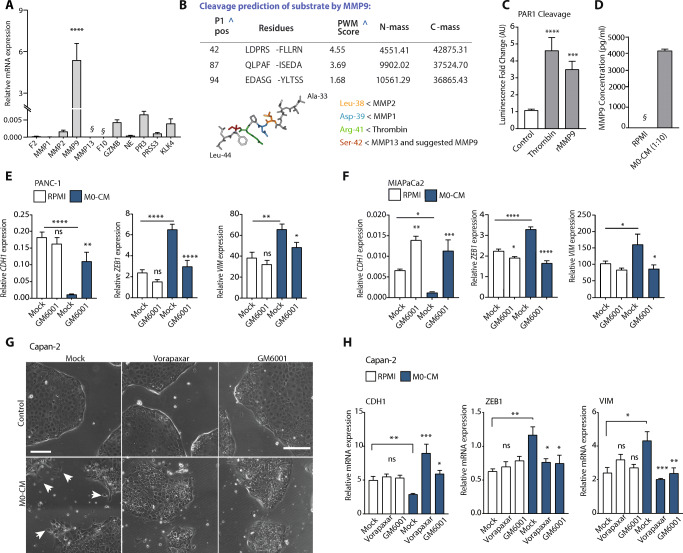
Fig. 4.
Macrophage-secreted MMP9 activates PAR1. (A) Relative mRNA expression levels of PAR1-cleaving proteases in M0 macrophages. The expression levels of F2 (Thrombin), MMP1, MMP2, MMP9, MMP13, F10 (FX), GZMB, NE, PR3, PRSS3 and KLK4 are shown as mean ± SEM (n = 4); Student’s t test. § indicates signals below the detection limit. (B) MMP9 cleavage prediction of the PAR1 N-terminal amino acid sequence, derived from the FASTA sequence of Uniprot ID: P25116. P1 position, sequence, and PWM (position weight matrices) are shown together with the mass of the N- and C-terminal sequences after cleavage. Below the table, a stick representation for the PAR1 N-terminal amino acid sequence, where protease cleavage sites are concentrated, is shown. In this representation, locations for MMP2 (yellow), MMP1 (blue), Thrombin (Green) and MMP13, together with MMP9 (red) are indicated. (C) Quantification of PAR1 cleavage with 100 nM recombinant MMP9 (rMMP9) and 0.1 U/ml Thrombin in PAR1-SEAP assays. N = 4. Error bars show mean ± SEM. One-way ANOVA. (D) MMP9 levels in M0-CM and RPMI-1640 media. Shown is the mean ± SEM (n = 4); Student’s t test. § indicates signals below the detection limit. (E-F) Relative mRNA expression of CDH1, ZEB1 and VIM in RPMI-1640 (white) or M0-CM (blue) treated PANC-1 (E) and MIA PaCa-2 (F) cells. MMP9 was inhibited by GM6001 (5 μM) using DMSO as a mock control. Shown is the mean ± SEM (n = 4); Student’s t test. (G) Phase-contrast microscope image of Capan-2 cells after control (1:1 DMEM+RPMI-1640) and M0-CM treatment. PAR1 was inhibited by Vorapaxar (500 nM), MMP9 was inhibited by GM6001 (5 μM), and DMSO served as a mock control. Shown are images at t = 72 h after the addition of M0-CM. Magnification is 10x, and scale bars indicate 100 μm. (H) Relative mRNA expression of CDH1, ZEB1 and VIM in RPMI-1640 (white) or M0-CM (blue) treated Capan-2 cells. PAR1 was inhibited by Vorapaxar (500 nM), MMP9 was inhibited by GM6001 (5 μM), and DMSO served as a mock control. Shown is the mean ± SEM (n = 4); Student’s t test. Relative expression levels, as depicted in panels E, F, and H, were calculated using the comparative threshold cycle (dCt method) and normalized to the expression of the reference gene TBP

