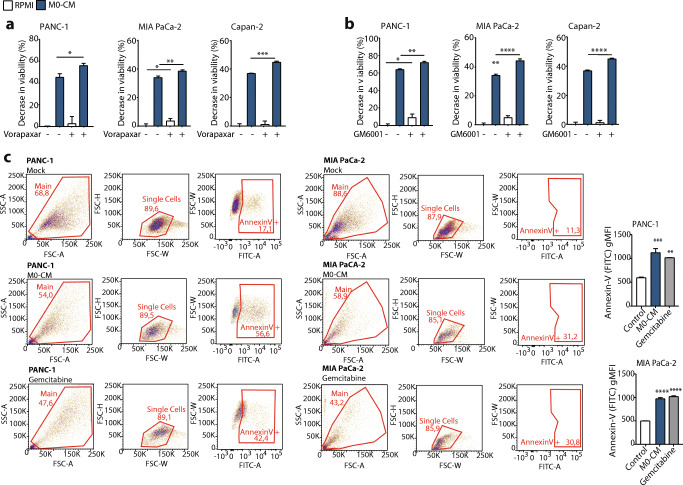
Fig. 5.
The PAR1-MMP9 axis reduces macrophage induced cytotoxicity. (A-B) MTT viability assay of PANC-1, MIA PaCa-2 and Capan-2 cells in RPMI-1640 (white) or M0-CM (blue) medium. Shown in the effect of PAR1 inhibition with 500 nM Vorapaxar (A) or MMP9 inhibition with 5 μM GM6001 (B). Decreased viability is calculated relative to the viability of control-treated cells. Shown is the mean ± SEM (n = 6); One-way ANOVA. (C) Annexin V-FITC+ cells in mock (RPMI-1640), M0-CM, or positive-control (Gemcitabine) treated PANC-1 and MIA PaCa-2 cells at t = 48 h. Left panel: gating strategy for the Annexin V+ population. The FITC gate was set on antibody controls. Right panel: geometric Mean Fluorescent Intensity (gMFI) on the FITC channel (Annexin V density) for Mock, M0-CM, and positive-control treated cells from the previous panel is given. Shown is the mean ± SEM (n = 3); One-way ANOVA

