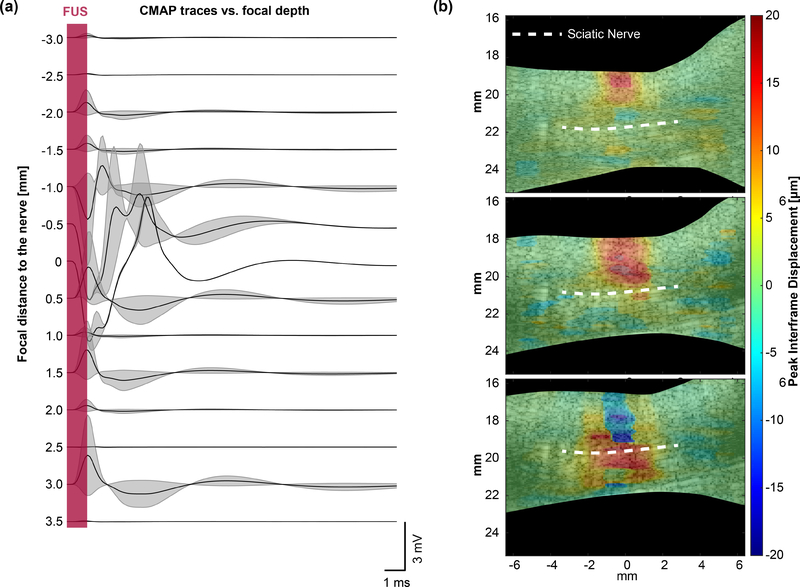
Fig. 6.
(a) Waterfall plot of example EMG traces acquired at increasing FUS focus depths with and without CMAP. The sciatic nerve (n = 2; 1 mouse) is placed at 0 mm. (b) Displacement maps showing interframe tissue displacement at subsequent focal depths corresponding to traces in (a). A 24 MPa (MI = 5.6), 1 ms ultrasound pulse was used to map the displacement at each depth.

