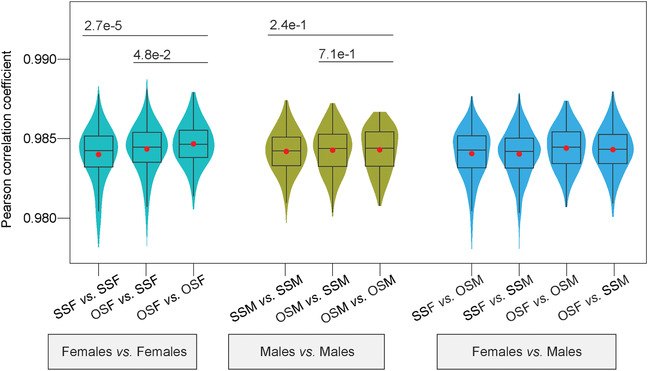
FIGURE 2.

Violin‐box plots show the distribution of Pearson's correlation coefficients between genomewide DNA methylations of any two samples from different two groups of twins. The red dots are the arithmetic means. The p‐values between two groups were shown and determined by Wilcoxon rank‐sum test.
