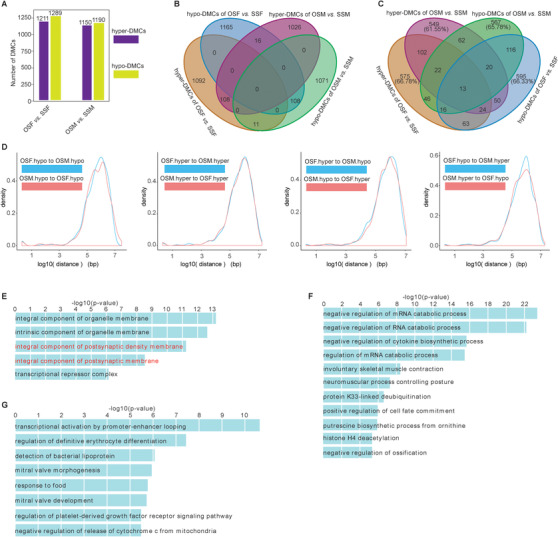
FIGURE 3.

Characterization of DMCs. A, Number of hyper‐ and hypo‐DMCs for OSFversus SSF, and OSM versus SSM. B, Venn diagrams displayed the overlap among the DMCs. C, Venn diagrams displayed the overlap among the DMCs‐associated genes. D, Distribution of distances between two sets of DMCs. E, Enrichment terms of gene ontology (GO, cellular components) with adjusted p‐value <10−5 were shown for the hyper‐DMCs of OSF versus SSF. F and G, Enrichment terms of gene ontology (biological process) with adjusted p‐value <10−5 were shown for the hyper‐DMCs (F) and hypo‐DMCs (G) of OSM versus SSM. The GO terms associated with nervous system were highlighted by red.
