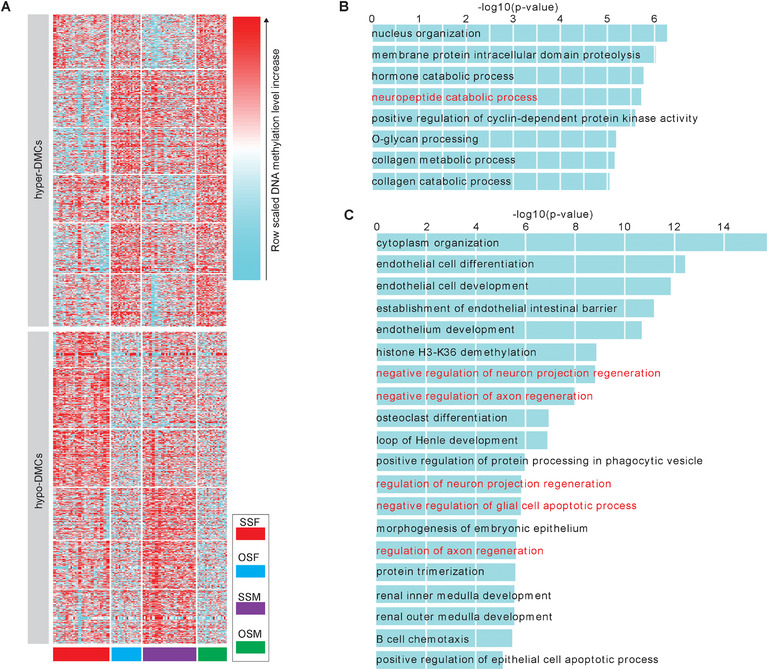
FIGURE 4.

Differentially methylated cytosines (DMCs) for OSF versus SSF, and OSM versus SSM. A, K‐means clustering for the all merged hyper‐ and hypo‐DMCs. The hyper‐DMCs or hypo‐DMCs for OSF versus SSF, and OSM versus SSM were merged if they had 1‐bp common region at least, respectively. The hyper‐DMRs (hypo‐DMRs) were classified into six clusters by k‐means clustering on row scaled DNA methylation level. B and C, Enrichment terms of gene ontology (GO, biological process) with adjusted p‐value <10−5 were shown for the hyper‐DMCs (B) and hypo‐DMCs (C) of OSFversus SSF. The terms associated with nervous system were highlighted by red.
