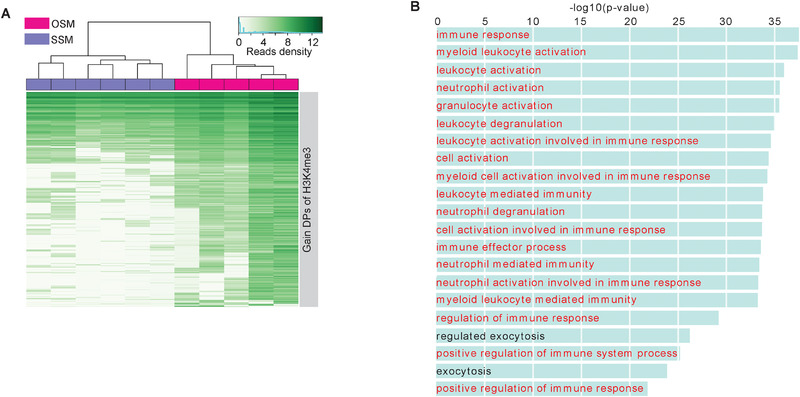
FIGURE 6.

H3K4me1 and H3K4me3 differential peaks (DPs) for OSM versus SSM. A, Hierarchical clustering for OSM and SSM twins based on H3K4me3 level at the H3K4me3 DPs of OSM versus SSM. B, Enrichment terms of gene ontology (biological process) with adjusted p‐value <10‐5 were shown for the 1643 GAIN H3K4me3 DPs of OSM versus SSM. The GO terms associated with immune system were highlighted by red.
