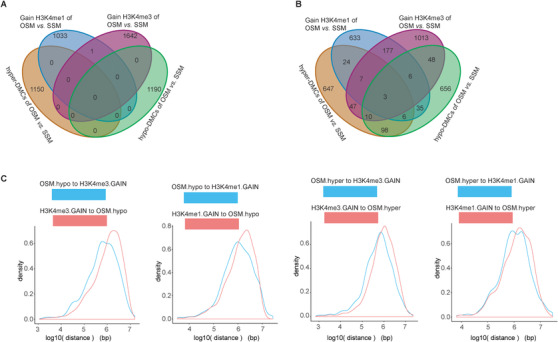
FIGURE 7.

Correlation between DPs and DMCs. A, Venn diagrams displayed the overlap among the DPs and DMCs. B, Venn diagrams displayed the overlap among the DPs and DMCs‐associated genes. C, Distribution of distances between the two sets, DMCs and DPs.
