
Figure 1.
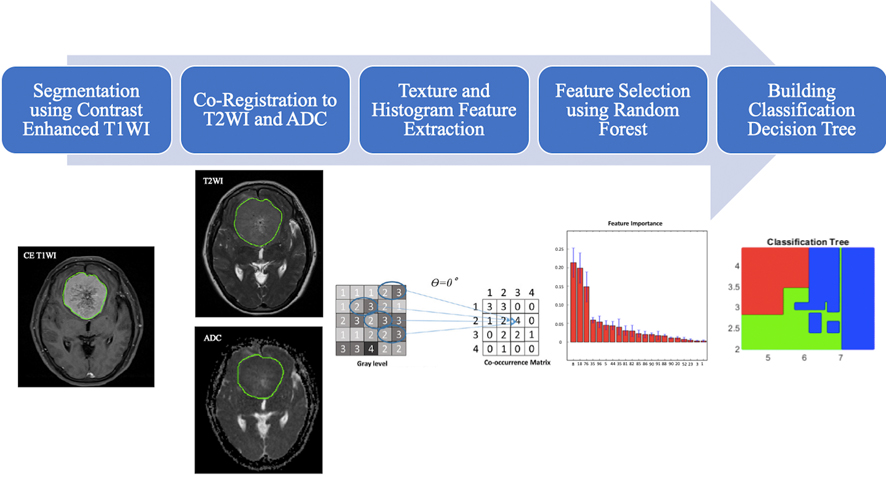
Flowchart of the analysis process. The tumor is segmented on contrast-enhanced T1WI, and then mapped to T2WI and ADC maps. On each set of images, a total of 33 texture and histogram features are extracted. The random forest algorithm is used to select features for building the classification model by using the decision tree.