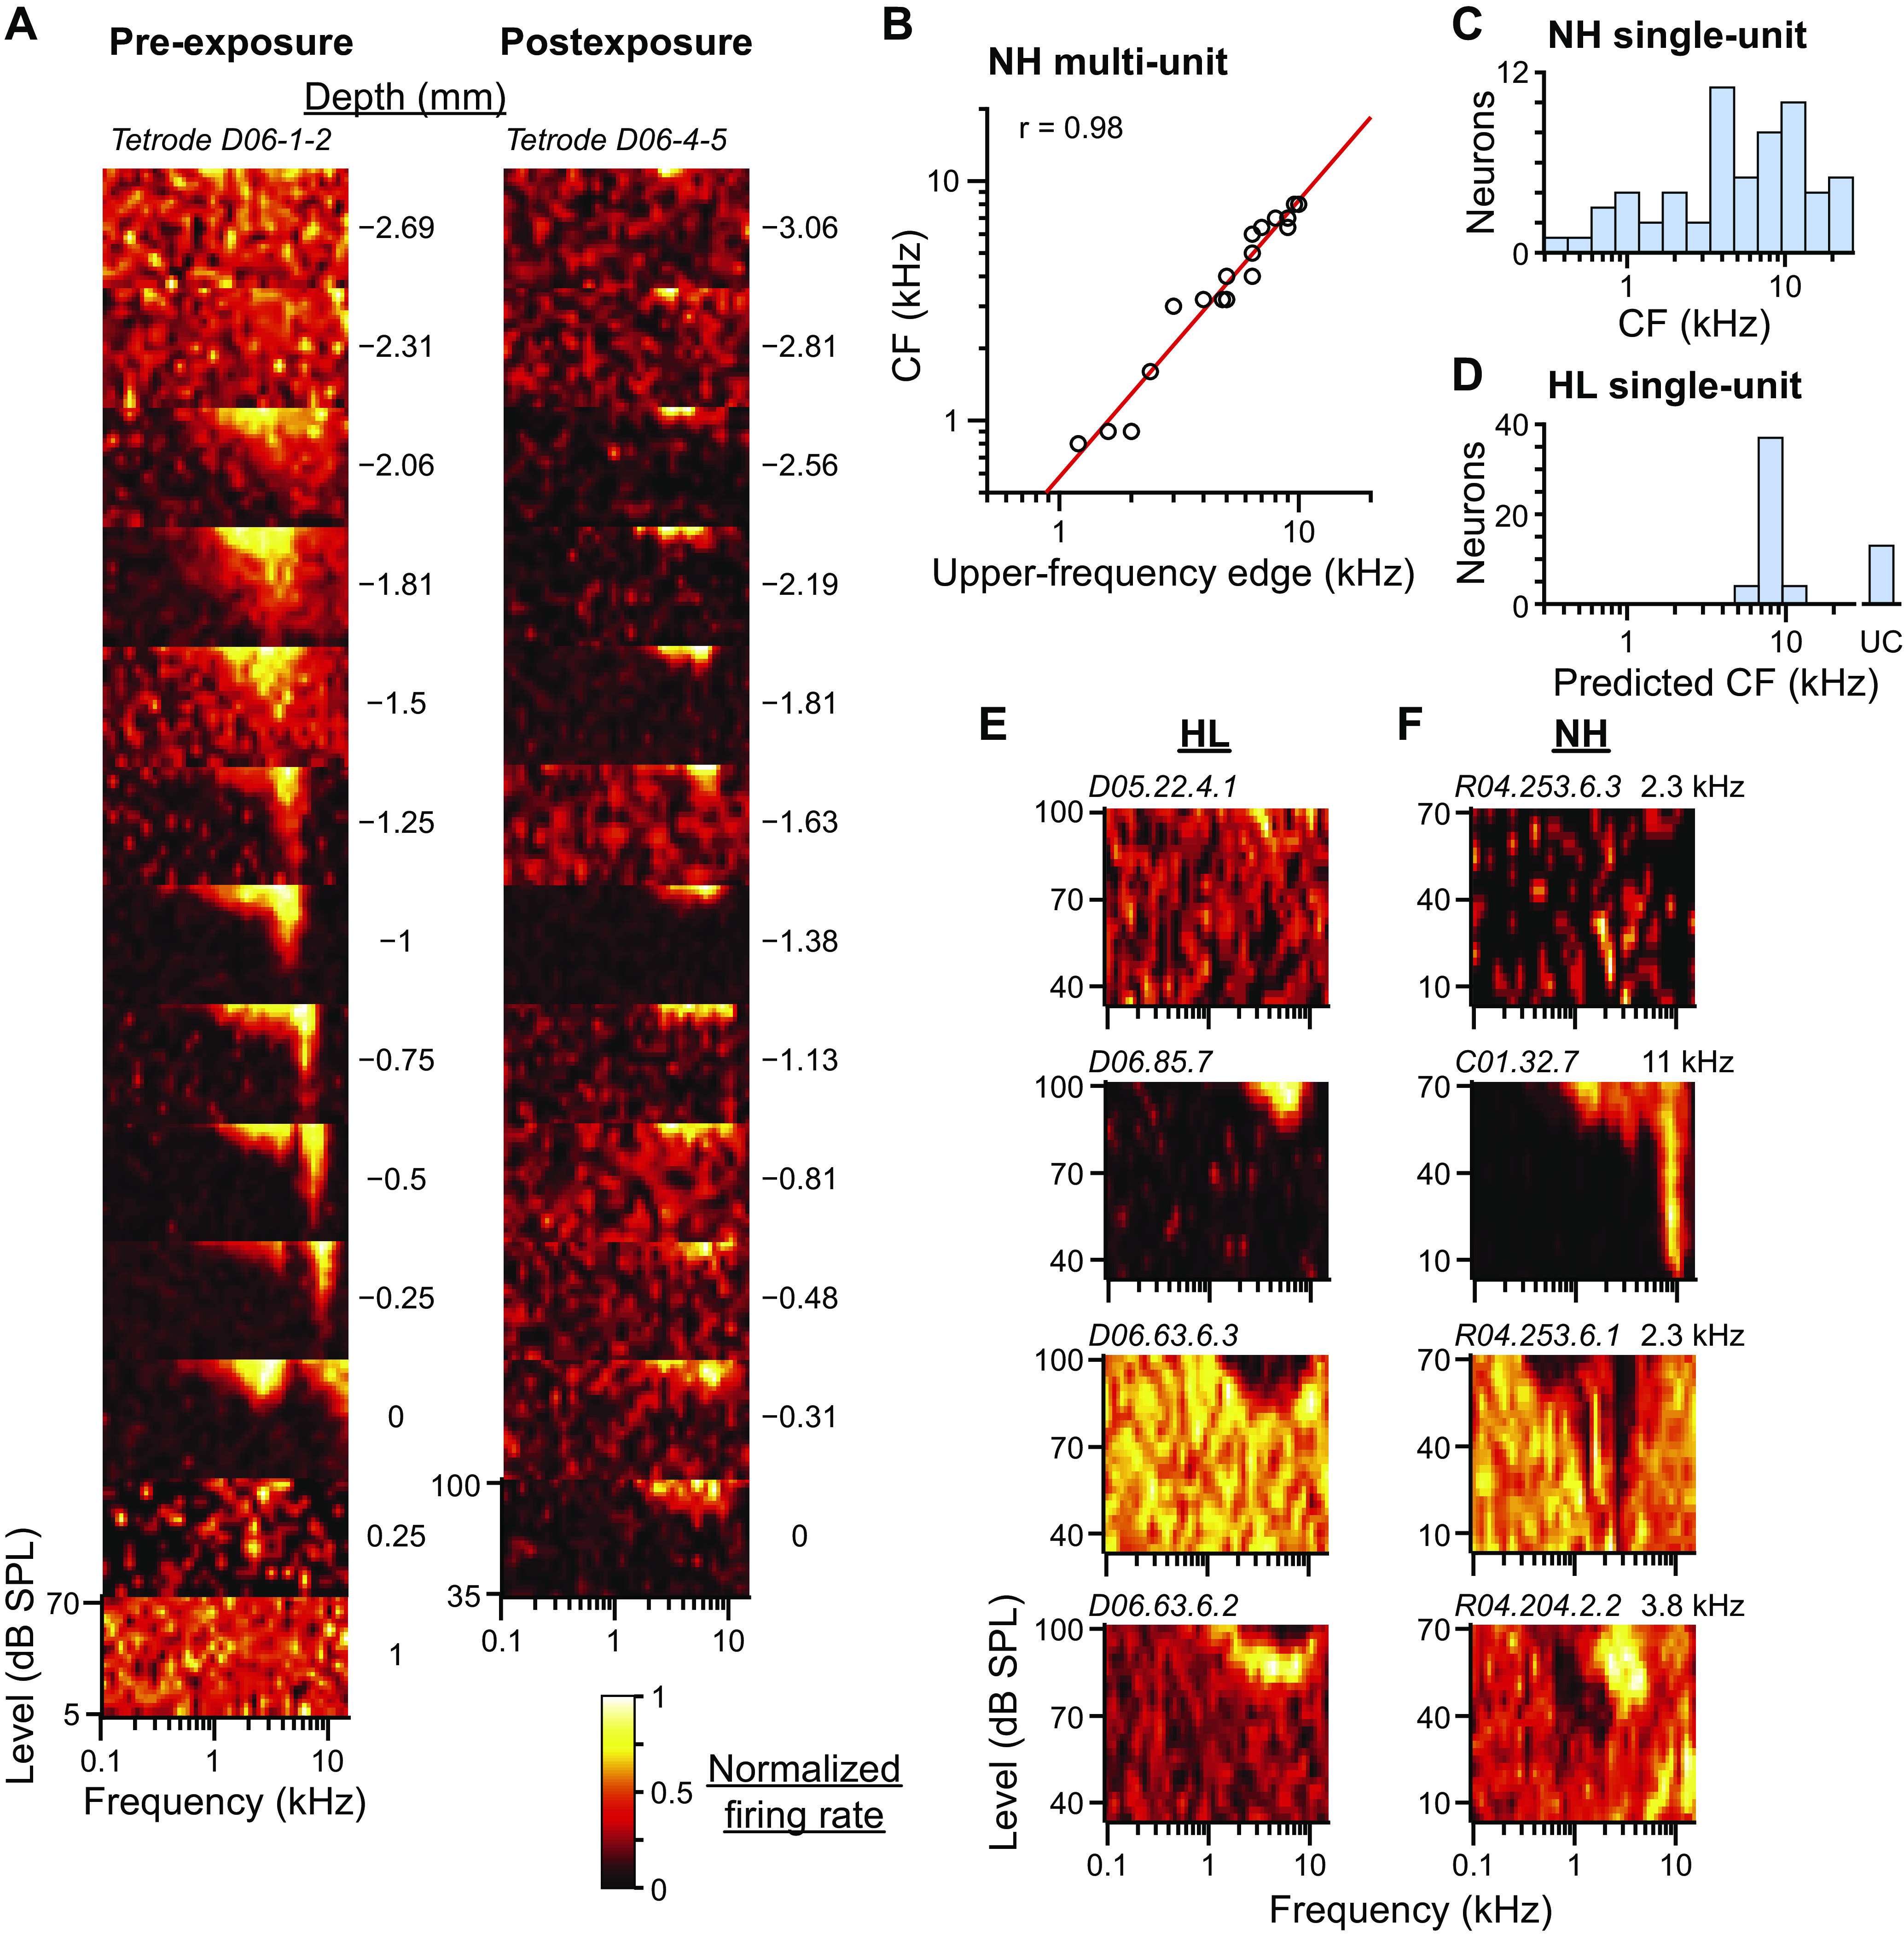
Fig. 2.

Frequency tuning following noise overexposure. A: multiunit frequency-and-level response areas (FRAs) recorded from two different tetrodes (tetrode IDs at top of each column) at 12–13 different depths (plots within each column). Depth relative to the ventral border of auditory-evoked activity is indicated to the right of each plot. Tetrodes were from the same rabbit before (left) and after (right) noise overexposure. In each FRA, the color associated with firing rate is normalized to highest (white) and lowest (black) rates. Before overexposure, tuning to frequency within the central nucleus of the inferior colliculus (ICC) clearly increases with depth. B: scatterplot of CF versus upper-frequency edge of multiunit FRAs measured at several depths along 5 different tetrodes in normal-hearing (NH) rabbits (N = 29 sites; several data points overlap). Red line is fit line with correlation coefficient indicated in top left corner. C: histogram of the CFs of neurons from NH rabbits (N = 60). D: histogram of the CFs of neurons from hearing loss (HL) rabbits predicted from the upper-frequency edge of the FRA measured from either the neuron or multiunit data at the same site (N = 58). Prediction made using the fit line in B. Neurons with no upper-frequency edges in their FRAs were unclassified (UC). E: example neurons from HL rabbits with FRAs with no tuning, or excitatory, inhibitory, or mixed excitatory and inhibitory regions (top to bottom). Neuron ID indicated in top left corner of each FRA. F: example neurons from NH rabbits demonstrating similar FRA subtypes to those in E. CF additionally indicated in top right corner of each FRA.
