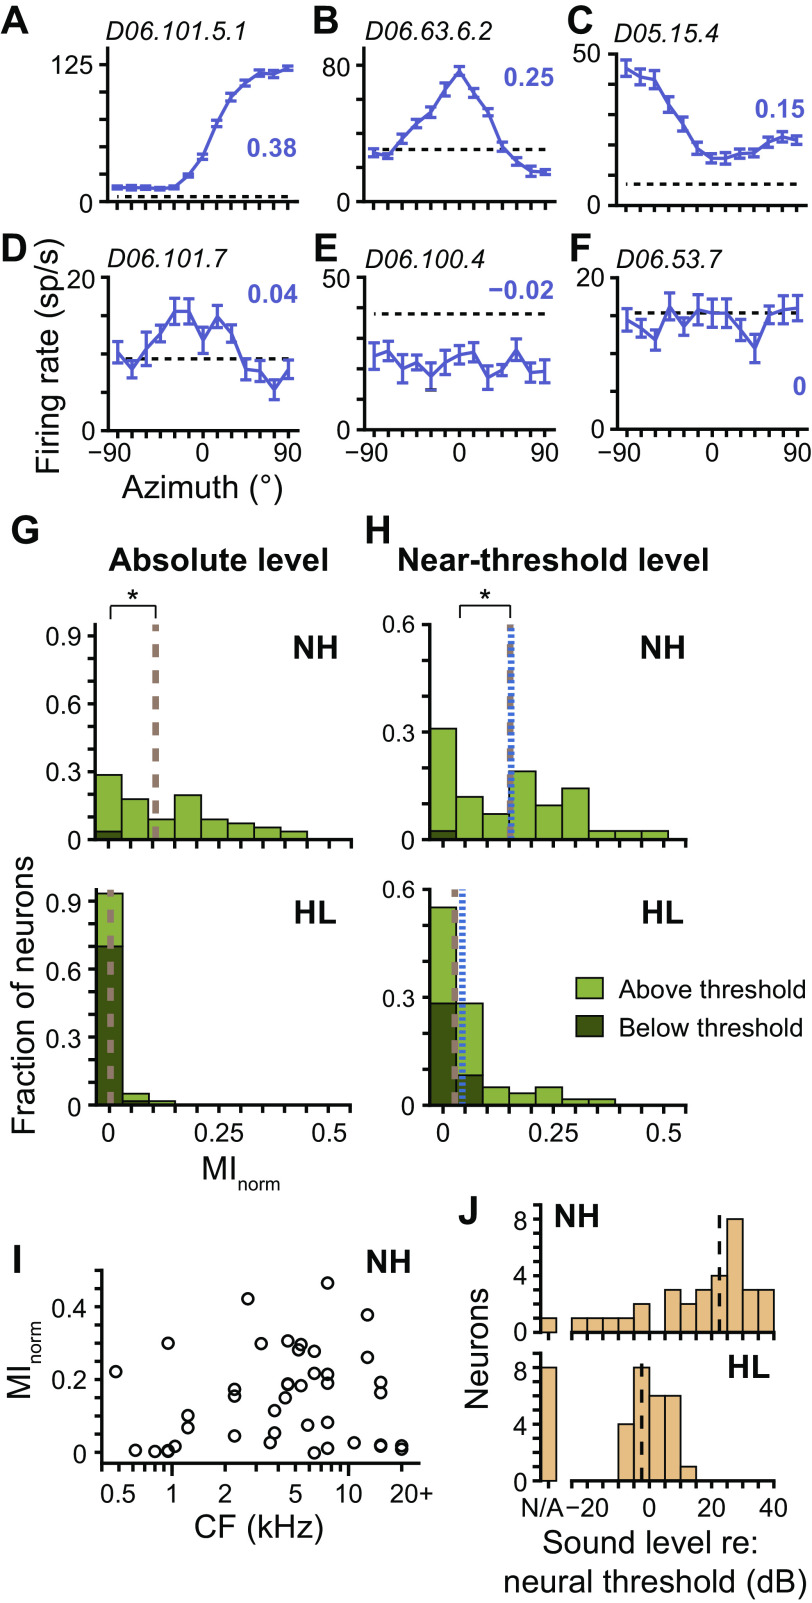
Fig. 4.
Directional sensitivity following noise overexposure. A–F: azimuth tuning curves of 6 different neurons from hearing loss (HL) rabbits measured at near-threshold level (purple curves; mean ± SE). Normalized mutual information (MInorm) of each curve indicated by bold purple no. adjacent to curve. Positive azimuths indicate sound source azimuths contralateral to the recording site. Broken black lines indicate spontaneous rate. Unit ID is indicated in top left corner of each plot. G: histograms of MInorm for azimuth tuning curves of neurons from normal-hearing (NH, top; N = 56) and HL (bottom; N = 60) rabbits measured at absolute level. Stacked light and dark green bins represent tuning curves that were and were not significantly different from spontaneous rate, respectively (i.e., above and below threshold, respectively; Wald tests with correction for multiple comparisons, P < 0.01). Overall medians indicated by brown broken lines. H: same as G for tuning curves measured at near-threshold level (top: NH, N = 42; bottom: HL, N = 60). Broken blue lines indicate medians computed only for tuning curves that were above threshold. *P < 0.05 (Wilcoxon rank-sum test). I: scatterplot of MInorm measured at near-threshold level versus CF for neurons from NH rabbits. J: histograms of near-threshold sound level with respect to each neuron’s threshold to diotic broadband noise for neurons from NH (top; N = 33) and HL (bottom; N = 33) rabbits. Data only included for neurons with azimuth tuning curves that were above threshold. “N/A” indicates neurons with no measurable thresholds. Black lines indicate medians computed under the assumption that sound levels associated with neurons with no thresholds were at the lowest end of the data set.

